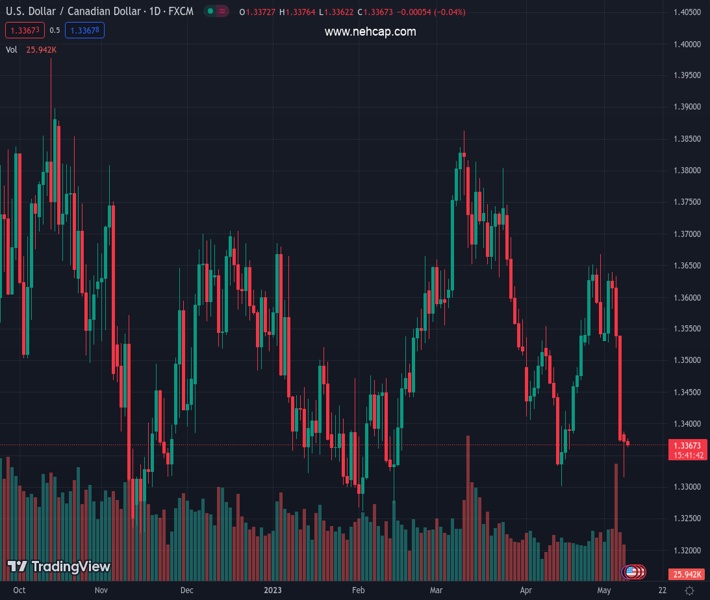
#USDCAD @ 1.33685 fades bounce off three-week low amid sluggish markets. (Pivot Orderbook analysis)
…
This is a premium post.
[s2If !current_user_can(access_s2member_level4)]Please register for FREE REGISTER to read full post below containing analysis. In case of any error or you think you are not able to read the full post below, please email us at support#nehcap.com [lwa][/s2If] [s2If current_user_can(access_s2member_level1)]
- USD/CAD fades bounce off three-week low amid sluggish markets.
- US Dollar struggles to defend recent gains, Oil price remains sidelined.
- Mixed sentiment about US debt-ceiling accord, banking turmoil prod Loonie pair traders.
The pair currently trades last at 1.33685.
The previous day high was 1.3388 while the previous day low was 1.3315. The daily 38.2% Fib levels comes at 1.336, expected to provide support. Similarly, the daily 61.8% fib level is at 1.3343, expected to provide support.
USD/CAD renews intraday low near 1.3365 as it fails to defend the week-start rebound amid sluggish markets during early Tuesday. Adding strength to the Loonie pair’s pullback moves could be the US Dollar’s struggle to defend the previous gains amid a cautious mood ahead of the key US debt-ceiling talks in the White House. It’s worth observing that mildly bid WTI crude oil, Canada’s key exports, also allows the quote to lure bears.
That said, the US Dollar Index (DXY) retreats to 101.42 while consolidating intraday gains amid unimpressive details of the Federal Reserve’s (Fed) quarterly bank loan survey. Even so, upbeat US inflation expectations, per 10-year and 5-year breakeven inflation rates from the St. Louis Federal Reserve (FRED) data, join fears of gloomy conditions if the US fails to extend the debt ceiling to put a floor under the greenback.
WTI crude oil clings to mild gains near $73.00, up for the fourth consecutive day, as fears of recession jostle with cautious optimism as major Asian nations open international borders. Furthermore, the easing fears of the bank crisis and the US Dollar’s inability to regain upside traction also allow the Oil price to grind higher.
Amid these plays, S&P 500 Futures remain indecisive near 4,150 while the US Treasury bond yields prod a three-day winning streak.
Moving on, a light calendar and cautious mood ahead of the top-tier data/events can keep restricting the USD/CAD moves. That said, today’s White House talks on altering the debt ceiling expiration, currently looming around June, will be crucial to determine short-term market moves. Given the wide differences among the US policymakers on the issue, the likely indecision and burden on the US Dollar can’t be ruled out. However, Wednesday’s likely upbeat US inflation numbers for April may defend the Loonie buyers, unless the dovish Fed concerns weigh on the quote while other things remain the same.
Despite the latest retreat in the USD/CAD prices, Monday’s bullish candlestick formation and a corrective bounce off an upward-sloping support line from November 2022 keep the buyers hopeful.
Also read: USD/CAD Price Analysis: Justifies Dragonfly Doji candlestick to bounce off key support line towards 1.3400
Technical Levels: Supports and Resistances
USDCAD currently trading at 1.3367 at the time of writing. Pair opened at 1.3375 and is trading with a change of -0.06% % .
| Overview | Overview.1 | |
|---|---|---|
| 0 | Today last price | 1.3367 |
| 1 | Today Daily Change | -0.0008 |
| 2 | Today Daily Change % | -0.06% |
| 3 | Today daily open | 1.3375 |
The pair remains strongly bearish on the daily time frame. It trades below the 20 SMA @ 1.3495, 50 SMA 1.3581, 100 SMA @ 1.3521 and 200 SMA @ 1.3449.
| Trends | Trends.1 | |
|---|---|---|
| 0 | Daily SMA20 | 1.3495 |
| 1 | Daily SMA50 | 1.3581 |
| 2 | Daily SMA100 | 1.3521 |
| 3 | Daily SMA200 | 1.3449 |
The previous day high was 1.3388 while the previous day low was 1.3315. The daily 38.2% Fib levels comes at 1.336, expected to provide support. Similarly, the daily 61.8% fib level is at 1.3343, expected to provide support.
Note the levels of interest below:
- Pivot support is noted at 1.3331, 1.3286, 1.3258
- Pivot resistance is noted at 1.3404, 1.3432, 1.3476
| Levels | Levels.1 |
|---|---|
| Previous Daily High | 1.3388 |
| Previous Daily Low | 1.3315 |
| Previous Weekly High | 1.3639 |
| Previous Weekly Low | 1.3371 |
| Previous Monthly High | 1.3668 |
| Previous Monthly Low | 1.3301 |
| Daily Fibonacci 38.2% | 1.3360 |
| Daily Fibonacci 61.8% | 1.3343 |
| Daily Pivot Point S1 | 1.3331 |
| Daily Pivot Point S2 | 1.3286 |
| Daily Pivot Point S3 | 1.3258 |
| Daily Pivot Point R1 | 1.3404 |
| Daily Pivot Point R2 | 1.3432 |
| Daily Pivot Point R3 | 1.3476 |
[/s2If]
Nehcap Expert Advisor
The NEHCAP MT4 EA is high quality professional trading system geared to generate returns without using GRID or martingales. Each trade has strict risk per trade parameter. The pairs under management include EURUSD, GBPUSD, AUDCAD, AUDNZD,GBPAUD, EURAUD, EURCAD, CHFJPY and many more.
The system is trading live: LIVE ACCOUNT TRACKING
You can run it free. Apply for a free trial and track our account. Buy the system or use profit share mechanism to generate returns on your MT4.
Join Our Telegram Group
")


