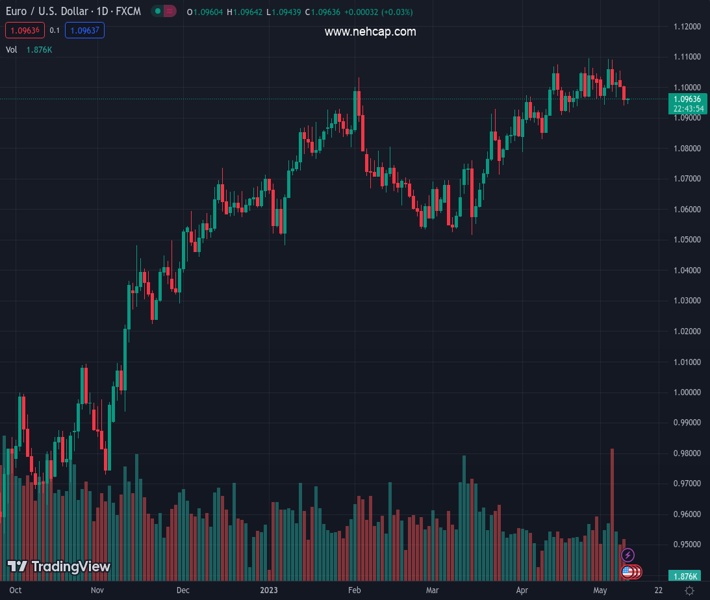
#EURUSD @ 1.09628 licks its wounds at the lowest levels in 13 days, prods two-day losing streak as the US inflation day begins. (Pivot Orderbook analysis)
…
This is a premium post.
[s2If !current_user_can(access_s2member_level4)]Please register for FREE REGISTER to read full post below containing analysis. In case of any error or you think you are not able to read the full post below, please email us at support#nehcap.com [lwa][/s2If] [s2If current_user_can(access_s2member_level1)]
- EUR/USD licks its wounds at the lowest levels in 13 days, prods two-day losing streak as the US inflation day begins.
- Fed’s Williams sounds hawkish despite downbeat US NFIB data.
- US debt-ceiling drama, banking woes keep weighing on sentiment.
- ECB hawks stay active but were mostly ignored as US Dollar defends recovery ahead of US CPI for April.
The pair currently trades last at 1.09628.
The previous day high was 1.1054 while the previous day low was 1.1. The daily 38.2% Fib levels comes at 1.1021, expected to provide resistance. Similarly, the daily 61.8% fib level is at 1.1033, expected to provide resistance.
EUR/USD holds lower grounds near 1.0960 as the key Wednesday’s trading begins in Asia, following a two-day downtrend. That said, the Euro pair dropped to the fresh low in two weeks the previous day amid broad US Dollar strength as markets prepare for today’s US Consumer Price Index (CPI) for April.
US Dollar Index (DXY) rose in the last two consecutive days despite unimpressive data and looming fears from the US banking sector, as well as the debt ceiling expiration. On Monday, the Fed Bank Loan Survey showed the uninspiring findings while US Senate Democratic leader Schumer recently said that House Speaker Kevin McCarthy, a Republican, refused to take default off the table.
Further, the US NFIB Small Business Optimism index dropped to the lowest level since 2013, to 89 in April. Even so, Federal Reserve Bank of New York President John Williams said, per Reuters, “Fed has not said it’s done raising rates.”
On the other hand, European Central Bank (ECB) policymaker Peter Kazimir said on Tuesday, “Based on current data, the ECB will have to keep raising interest rates for longer than anticipated.” On the same line, ECB policymaker Martins Kazaks warned on Tuesday, “Rate-hiking may not be finished in July.
It’s worth noting that a dearth of major data/events joined pre-inflation anxiety and hawkish Fed talks, as well as fears emanating from the US debt ceiling expiration and banking sector, to weigh on the sentiment, which in turn favored the US Dollar and lured EUR/USD sellers.
That said, Wall Street closed with mild losses whereas the US Treasury bond yields remained firmer by the end of Tuesday’s North American session.
Moving on, final readings of Germany’s inflation gauge, per the
Harmonized Index of Consumer Prices (HICP) for April, expected to confirm 7.6% YoY forecasts, may entertain EUR/USD pair traders ahead of the all-important US CPI for the said month. Forecasts suggest a minor MoM increase in the headlines CPI and a softening in the Core CPI. However, any positive surprise or matching of the figures with the market consensus can allow the Fed to remain hawkish and the same can exert downside pressure on the major currency pair.
Also read: US April CPI Preview: How will inflation data influence Fed rate outlook?
Although a triple bottom around 1.0940 highlights the levels as the key support, a daily close below the 21-DMA level of near 1.1000 keeps EUR/USD bears hopeful.
Technical Levels: Supports and Resistances
EURUSD currently trading at 1.0956 at the time of writing. Pair opened at 1.1007 and is trading with a change of -0.46% % .
| Overview | Overview.1 | |
|---|---|---|
| 0 | Today last price | 1.0956 |
| 1 | Today Daily Change | -0.0051 |
| 2 | Today Daily Change % | -0.46% |
| 3 | Today daily open | 1.1007 |
The pair is trading below its 20 Daily moving average @ 1.0997, above its 50 Daily moving average @ 1.0847 , above its 100 Daily moving average @ 1.0786 and above its 200 Daily moving average @ 1.0438
| Trends | Trends.1 | |
|---|---|---|
| 0 | Daily SMA20 | 1.0997 |
| 1 | Daily SMA50 | 1.0847 |
| 2 | Daily SMA100 | 1.0786 |
| 3 | Daily SMA200 | 1.0438 |
The previous day high was 1.1054 while the previous day low was 1.1. The daily 38.2% Fib levels comes at 1.1021, expected to provide resistance. Similarly, the daily 61.8% fib level is at 1.1033, expected to provide resistance.
Note the levels of interest below:
- Pivot support is noted at 1.0987, 1.0967, 1.0933
- Pivot resistance is noted at 1.104, 1.1074, 1.1094
| Levels | Levels.1 |
|---|---|
| Previous Daily High | 1.1054 |
| Previous Daily Low | 1.1000 |
| Previous Weekly High | 1.1092 |
| Previous Weekly Low | 1.0942 |
| Previous Monthly High | 1.1095 |
| Previous Monthly Low | 1.0788 |
| Daily Fibonacci 38.2% | 1.1021 |
| Daily Fibonacci 61.8% | 1.1033 |
| Daily Pivot Point S1 | 1.0987 |
| Daily Pivot Point S2 | 1.0967 |
| Daily Pivot Point S3 | 1.0933 |
| Daily Pivot Point R1 | 1.1040 |
| Daily Pivot Point R2 | 1.1074 |
| Daily Pivot Point R3 | 1.1094 |
[/s2If]
Nehcap Expert Advisor
The NEHCAP MT4 EA is high quality professional trading system geared to generate returns without using GRID or martingales. Each trade has strict risk per trade parameter. The pairs under management include EURUSD, GBPUSD, AUDCAD, AUDNZD,GBPAUD, EURAUD, EURCAD, CHFJPY and many more.
The system is trading live: LIVE ACCOUNT TRACKING
You can run it free. Apply for a free trial and track our account. Buy the system or use profit share mechanism to generate returns on your MT4.
Join Our Telegram Group
")


