Asian stocks have shown strength as uncertainty over the US debt ceiling has improved appeal for Asian markets. (Pivot Orderbook analysis)
…
This is a premium post.
[s2If !current_user_can(access_s2member_level4)]Please register for FREE REGISTER to read full post below containing analysis. In case of any error or you think you are not able to read the full post below, please email us at support#nehcap.com [lwa][/s2If] [s2If current_user_can(access_s2member_level1)]
- Asian stocks have shown strength as uncertainty over the US debt ceiling has improved appeal for Asian markets.
- Chinese equities are accelerating after the release of better-than-anticipated Trade Balance data.
- Fears of bleak oil demand outlook could renew if US inflation continues to remain persistent.
The pair currently trades last at 29029.22.
The previous day high was 29116.77 while the previous day low was 28912.62. The daily 38.2% Fib levels comes at 28990.61, expected to provide support. Similarly, the daily 61.8% fib level is at 29038.78, expected to provide resistance.
Markets in the Asian domain are showing immense strength as uncertainty over the United States’ economic outlook due to the debt ceiling crisis has improved the outlook for the largest continent’s appeal. Uncertainty over the US debt-ceiling issues kept S&P500 choppy on Monday.
The US Dollar Index (DXY) has sensed capped upside after a sharp recovery to near 101.52. The USD Index could add more gains as the Federal Reserve (Fed) is expected to keep interest rates higher for a longer period as labor market conditions are showing resilience amid solid demand for manpower.
At the press time, Japan’s Nikkei225 jumped almost 1%, China50 climbed 0.77%, Nifty50 gained 0.43% and Hang Seng dropped 0.40%.
Japanese stocks are outperforming other Asian markets as annual Labor Cash Earnings (March) have soared sharply. The economic data landed at 0.8%, matched expectations but remained below the former pace of 1.1%. A slower earnings growth indicates that domestic demand will get spurted as households won’t shy from increasing spending for core goods.
Chinese equities are accelerating after the release of better-than-anticipated Trade Balance data. The Trade Balance report indicates that domestic demand is still shy of recovery despite monetary and fiscal support from the administration. Also, export figures have beaten expectations but a slower growth against the prior pace is indicating a challenging outlook for the economy.
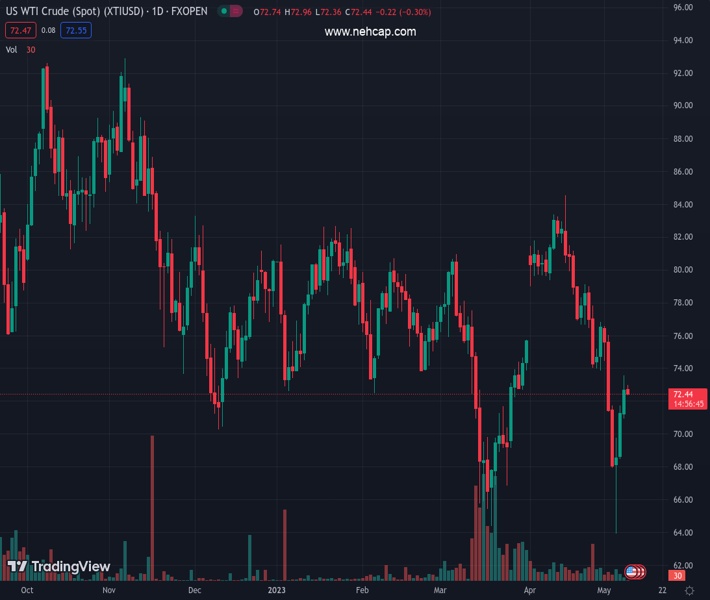
On the oil front, oil prices have turned sideways below $73.00 ahead of the US inflation data. Fears of bleak oil demand outlook could renew if US inflation continues to remain persistent.
Technical Levels: Supports and Resistances
XTIUSD currently trading at 29029.22 at the time of writing. Pair opened at 29029.22 and is trading with a change of 0.0 % .
| Overview | Overview.1 | |
|---|---|---|
| 0 | Today last price | 29029.22 |
| 1 | Today Daily Change | 0.00 |
| 2 | Today Daily Change % | 0.00 |
| 3 | Today daily open | 29029.22 |
The pair remains strongly bullish on the daily timeframe. It trades above its 20 SMA @ 28619.78, 50 SMA 28070.31, 100 SMA @ 27475.66 and 200 SMA @ 27586.54.
| Trends | Trends.1 | |
|---|---|---|
| 0 | Daily SMA20 | 28619.78 |
| 1 | Daily SMA50 | 28070.31 |
| 2 | Daily SMA100 | 27475.66 |
| 3 | Daily SMA200 | 27586.54 |
The previous day high was 29116.77 while the previous day low was 28912.62. The daily 38.2% Fib levels comes at 28990.61, expected to provide support. Similarly, the daily 61.8% fib level is at 29038.78, expected to provide resistance.
Note the levels of interest below:
- Pivot support is noted at 28922.3, 28815.39, 28718.15
- Pivot resistance is noted at 29126.45, 29223.69, 29330.6
| Levels | Levels.1 |
|---|---|
| Previous Daily High | 29116.77 |
| Previous Daily Low | 28912.62 |
| Previous Weekly High | 29284.92 |
| Previous Weekly Low | 28544.43 |
| Previous Monthly High | 29058.52 |
| Previous Monthly Low | 27562.51 |
| Daily Fibonacci 38.2% | 28990.61 |
| Daily Fibonacci 61.8% | 29038.78 |
| Daily Pivot Point S1 | 28922.30 |
| Daily Pivot Point S2 | 28815.39 |
| Daily Pivot Point S3 | 28718.15 |
| Daily Pivot Point R1 | 29126.45 |
| Daily Pivot Point R2 | 29223.69 |
| Daily Pivot Point R3 | 29330.60 |
[/s2If]
Nehcap Expert Advisor
The NEHCAP MT4 EA is high quality professional trading system geared to generate returns without using GRID or martingales. Each trade has strict risk per trade parameter. The pairs under management include EURUSD, GBPUSD, AUDCAD, AUDNZD,GBPAUD, EURAUD, EURCAD, CHFJPY and many more.
The system is trading live: LIVE ACCOUNT TRACKING
You can run it free. Apply for a free trial and track our account. Buy the system or use profit share mechanism to generate returns on your MT4.
Join Our Telegram Group
")


