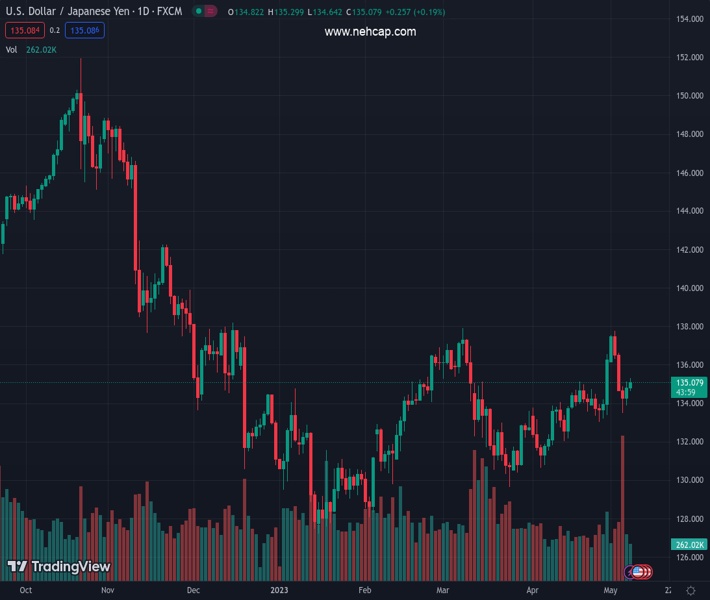
#USDJPY @ 135.097 is upward biased, with price action trading above weekly EMAs. (Pivot Orderbook analysis)
…
This is a premium post.
[s2If !current_user_can(access_s2member_level4)]Please register for FREE REGISTER to read full post below containing analysis. In case of any error or you think you are not able to read the full post below, please email us at support#nehcap.com [lwa][/s2If] [s2If current_user_can(access_s2member_level1)]
- USD/JPY is upward biased, with price action trading above weekly EMAs.
- Bullish-engulfing candle pattern suggests further upside is expected.
- A break above the 136.00 figure exposes last week’s swing high at 137.77.
The pair currently trades last at 135.097.
The previous day high was 135.12 while the previous day low was 133.88. The daily 38.2% Fib levels comes at 134.65, expected to provide support. Similarly, the daily 61.8% fib level is at 134.36, expected to provide support.
The USD/JPY accelerated above the 135.00 figure after the pair bounced off its daily low of 134.64, on fundamental news turning the market sour and a dovish stance by the Bank of Japan (BoJ), according to the March minutes. At the time of writing, the USD/JPY is trading at 135.15, gaining 0.28%.
From the weekly chart perspective, the USD/JPY is upward biased, with price action trading above its weekly EMAs. Although last week’s candlestick was bearish, downside risks lie below the 50-WMA at 132.90, followed by 129.65. Hence, if USD/JPY stays above the previously-mentioned support levels, its path of least resistance is upwards. Additionally, the Relative Strength Index (RSI) indicator just crossed the 50-neutral line to bullish territory, suggesting buyers are gathering momentum.
The USD/JPY, daily chart timeframe portrays the major trading sideways, as the EMAs remain flat. Nevertheless, the price action of May 4 and 5th formed a two-candlestick chart pattern known as a bullish-engulfing candle pattern, suggesting that further upside is expected.
If USD/JPY stays above 135.00, the first resistance would be the 136.00 figure. The break above will expose the May 3 daily high of 136.62, followed by the last week’s swing high at 137.77. Conversely, if USD/JPY drops below 135.00, that could open the door to testing the 100-day EMA at 134.20 before testing the confluence of the 50 and 200 EMA at 133.69/80.
Technical Levels: Supports and Resistances
USDJPY currently trading at 135.12 at the time of writing. Pair opened at 134.83 and is trading with a change of 0.22 % .
| Overview | Overview.1 | |
|---|---|---|
| 0 | Today last price | 135.12 |
| 1 | Today Daily Change | 0.29 |
| 2 | Today Daily Change % | 0.22 |
| 3 | Today daily open | 134.83 |
The pair is trading above its 20 Daily moving average @ 134.41, above its 50 Daily moving average @ 133.88 , above its 100 Daily moving average @ 132.84 and below its 200 Daily moving average @ 136.99
| Trends | Trends.1 | |
|---|---|---|
| 0 | Daily SMA20 | 134.41 |
| 1 | Daily SMA50 | 133.88 |
| 2 | Daily SMA100 | 132.84 |
| 3 | Daily SMA200 | 136.99 |
The previous day high was 135.12 while the previous day low was 133.88. The daily 38.2% Fib levels comes at 134.65, expected to provide support. Similarly, the daily 61.8% fib level is at 134.36, expected to provide support.
Note the levels of interest below:
- Pivot support is noted at 134.1, 133.37, 132.86
- Pivot resistance is noted at 135.34, 135.85, 136.58
| Levels | Levels.1 |
|---|---|
| Previous Daily High | 135.12 |
| Previous Daily Low | 133.88 |
| Previous Weekly High | 137.78 |
| Previous Weekly Low | 133.50 |
| Previous Monthly High | 136.56 |
| Previous Monthly Low | 130.63 |
| Daily Fibonacci 38.2% | 134.65 |
| Daily Fibonacci 61.8% | 134.36 |
| Daily Pivot Point S1 | 134.10 |
| Daily Pivot Point S2 | 133.37 |
| Daily Pivot Point S3 | 132.86 |
| Daily Pivot Point R1 | 135.34 |
| Daily Pivot Point R2 | 135.85 |
| Daily Pivot Point R3 | 136.58 |
[/s2If]
Nehcap Expert Advisor
The NEHCAP MT4 EA is high quality professional trading system geared to generate returns without using GRID or martingales. Each trade has strict risk per trade parameter. The pairs under management include EURUSD, GBPUSD, AUDCAD, AUDNZD,GBPAUD, EURAUD, EURCAD, CHFJPY and many more.
The system is trading live: LIVE ACCOUNT TRACKING
You can run it free. Apply for a free trial and track our account. Buy the system or use profit share mechanism to generate returns on your MT4.
Join Our Telegram Group
")


