#USDCHF @ 0.88990 pair begins the week with minimal losses as risk aversion continues in the driver’s seat. (Pivot Orderbook analysis)
…
This is a premium post.
[s2If !current_user_can(access_s2member_level4)]Please register for FREE REGISTER to read full post below containing analysis. In case of any error or you think you are not able to read the full post below, please email us at support#nehcap.com [lwa][/s2If] [s2If current_user_can(access_s2member_level1)]
- USD/CHF pair begins the week with minimal losses as risk aversion continues in the driver’s seat.
- US Wholesale inventories were unchanged in March, jumping 9.1% annually despite a first-quarter decline.
- Traders are eying the Fed’s Senior Loan Officer Survey alongside US inflation data.
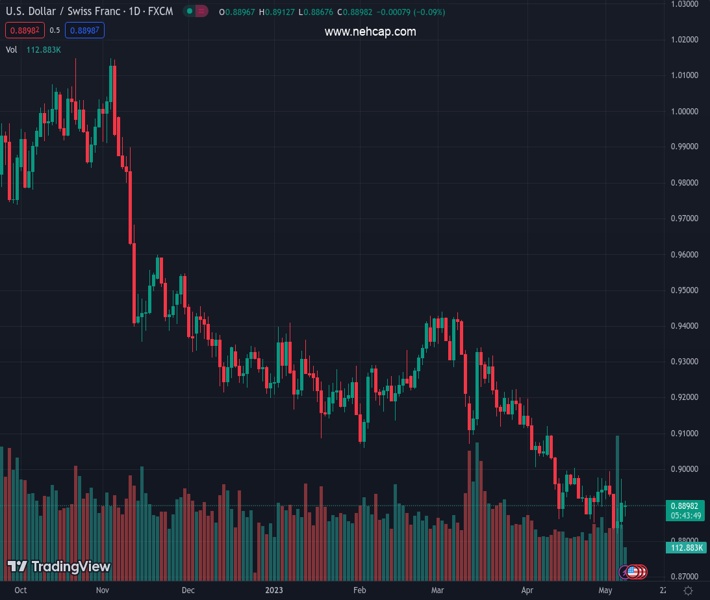
The pair currently trades last at 0.88990.
The previous day high was 0.8974 while the previous day low was 0.8835. The daily 38.2% Fib levels comes at 0.8921, expected to provide resistance. Similarly, the daily 61.8% fib level is at 0.8888, expected to provide support.
The USD/CHF pair commenced the week with minimal losses of 0.15%, even though the latest round of inflation data in Switzerland suggested that the Swiss National Bank (SNB) could adopt a less hawkish approach. The latest United States (US) data flashed a solid labor market, though traders are eyeing inflationary data during the week. At the time of writing, the USD/CHF is trading at 0.8891, below its opening price by 0.15%.
The USD/CHF is set to continue to slump during the day, as the US Dollar Index (DXY), a gauge of the buck’s value vs. a basket of six currencies, is down 0.02%, at 101.190. US equities trend lower as investors are eying the latest Senior Loan Officer Survey (SLOOS) revealed by the Fed amidst the ongoing US banking turmoil.
Although US bank equities have recovered some ground, Wall Street remains under stress, as sentiment took a hit, as the debt limit discussions in the US show no sign of improvement. The US Treasury Secretary, Janet Yellen, commented that there are no “good options” for solving the debt ceiling in Washington without the US Congress’s help.
Data-wise, the US economic agenda revealed that Wholesale Inventories were unchanged in March, below estimates of 0.1% MoM, the US Department of Commerce revealed. Annually based, inventories jumped 9.1% in March, despite the first quarter decline, as more robust US consumer spending contributed to the inventory rundown.
From a daily chart perspective, the USD/CHF is still downward biased, though trading above the year-to-date (YTD) lows of 0.8820. However, as price action continues to a downtrend, the Relative Strength Index (RSI) indicator registers higher troughs, meaning a positive divergence is surfacing. Therefore, that could open the door for further upside, but RSI needs to crack above the 50-midline. Downside risks in the USD/CHF lie at 0.8820, followed by 0.8800. Conversely, if USD/CHF reclaims 0.8900, further gains are warranted, though a downslope resistance trendline emerges at 0.8970, before climbing above 0.9000.
Technical Levels: Supports and Resistances
USDCHF currently trading at 0.8898 at the time of writing. Pair opened at 0.8909 and is trading with a change of -0.12 % .
| Overview | Overview.1 | |
|---|---|---|
| 0 | Today last price | 0.8898 |
| 1 | Today Daily Change | -0.0011 |
| 2 | Today Daily Change % | -0.1200 |
| 3 | Today daily open | 0.8909 |
The pair remains strongly bearish on the daily time frame. It trades below the 20 SMA @ 0.8939, 50 SMA 0.9116, 100 SMA @ 0.9184 and 200 SMA @ 0.9431.
| Trends | Trends.1 | |
|---|---|---|
| 0 | Daily SMA20 | 0.8939 |
| 1 | Daily SMA50 | 0.9116 |
| 2 | Daily SMA100 | 0.9184 |
| 3 | Daily SMA200 | 0.9431 |
The previous day high was 0.8974 while the previous day low was 0.8835. The daily 38.2% Fib levels comes at 0.8921, expected to provide resistance. Similarly, the daily 61.8% fib level is at 0.8888, expected to provide support.
Note the levels of interest below:
- Pivot support is noted at 0.8838, 0.8767, 0.8699
- Pivot resistance is noted at 0.8977, 0.9045, 0.9116
| Levels | Levels.1 |
|---|---|
| Previous Daily High | 0.8974 |
| Previous Daily Low | 0.8835 |
| Previous Weekly High | 0.8995 |
| Previous Weekly Low | 0.8820 |
| Previous Monthly High | 0.9198 |
| Previous Monthly Low | 0.8852 |
| Daily Fibonacci 38.2% | 0.8921 |
| Daily Fibonacci 61.8% | 0.8888 |
| Daily Pivot Point S1 | 0.8838 |
| Daily Pivot Point S2 | 0.8767 |
| Daily Pivot Point S3 | 0.8699 |
| Daily Pivot Point R1 | 0.8977 |
| Daily Pivot Point R2 | 0.9045 |
| Daily Pivot Point R3 | 0.9116 |
[/s2If]
Nehcap Expert Advisor
The NEHCAP MT4 EA is high quality professional trading system geared to generate returns without using GRID or martingales. Each trade has strict risk per trade parameter. The pairs under management include EURUSD, GBPUSD, AUDCAD, AUDNZD,GBPAUD, EURAUD, EURCAD, CHFJPY and many more.
The system is trading live: LIVE ACCOUNT TRACKING
You can run it free. Apply for a free trial and track our account. Buy the system or use profit share mechanism to generate returns on your MT4.
Join Our Telegram Group
")


