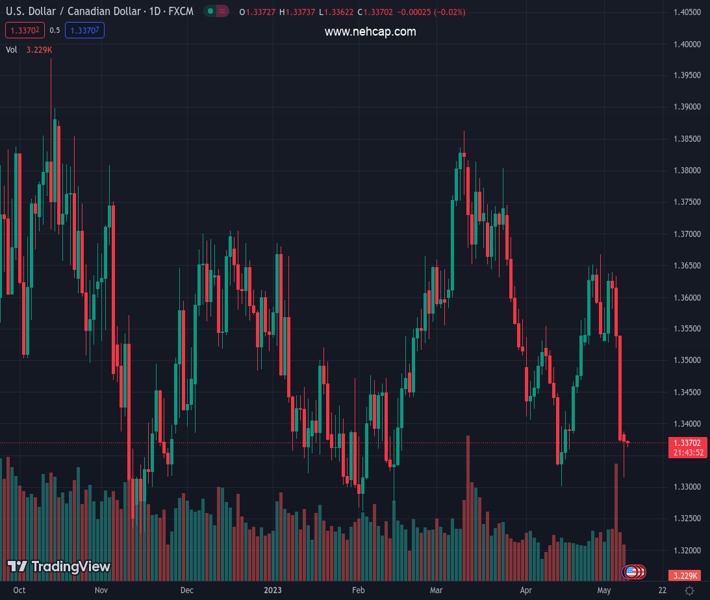
#USDCAD @ 1.33697 is aiming for a recovery extension towards 1.3400 as USD Index has attempted a recovery. (Pivot Orderbook analysis)
…
This is a premium post.
[s2If !current_user_can(access_s2member_level4)]Please register for FREE REGISTER to read full post below containing analysis. In case of any error or you think you are not able to read the full post below, please email us at support#nehcap.com [lwa][/s2If] [s2If current_user_can(access_s2member_level1)]
- USD/CAD is aiming for a recovery extension towards 1.3400 as USD Index has attempted a recovery.
- A consistent increment in US NFP, households’ earnings, and lower jobless rate indicate that the US CPI to remain stubborn ahead.
- Investors’ risk appetite has slimmed as US quarterly result season is entering its last phase.
The pair currently trades last at 1.33697.
The previous day high was 1.3542 while the previous day low was 1.3371. The daily 38.2% Fib levels comes at 1.3436, expected to provide resistance. Similarly, the daily 61.8% fib level is at 1.3476, expected to provide resistance.
The USD/CAD pair is gathering strength for extending the recovery move above the immediate resistance of 1.3385 in the early Asian session. The Loonie asset is being supported by a recovery in the US Dollar Index (DXY) and a loss in the oil’s upside momentum.
The USD Index has displayed a reversal move, which is yet to cross a lot of parameters, after defending the critical support of 101.00. Investors have jumped for the US Dollar ahead of the release of the US Inflation data, which will release on Wednesday. A consistent increment in US Nonfarm Payrolls (NFP), a significant jump in households’ earnings, and historic lows Unemployment Rate indicate that the US Consumer Price Index (CPI) is expected to remain stubborn ahead.
Federal Reserve (Fed) chair Jerome Powell was ‘loud and clear’ in May’s monetary policy meeting that further action will be data-dependent and scrutiny of April’s Employment report indicates that the Fed has a long way to go. Bill Winters, CEO of Standard Chartered Bank said Monday, the US Federal Reserve looks set to temporarily pause its aggressive monetary tightening agenda, but it has not yet finished the job, as reported by CNBC. He further added that the wage spiral is pushing up prices and causing inflation to become embedded.
Meanwhile, S&P500 futures are showing some losses in early Tokyo after a sideways Monday, indicating some decline in the risk appetite of the market participants as the quarterly result season is entering into its last phase.
On the oil front, oil prices are facing barricades in extending their recovery further as major economies are showing signs of recession due to higher interest rates. Accelerating borrowing costs by central banks have resulted in lower credit disbursement by commercial banks, indicating a forward decline in the oil demand. It is worth noting that Canada is the leading exporter of oil to the United States and signs of decline in the oil price impact the Canadian Dollar.
Technical Levels: Supports and Resistances
USDCAD currently trading at 1.3372 at the time of writing. Pair opened at 1.3374 and is trading with a change of -0.01 % .
| Overview | Overview.1 | |
|---|---|---|
| 0 | Today last price | 1.3372 |
| 1 | Today Daily Change | -0.0002 |
| 2 | Today Daily Change % | -0.0100 |
| 3 | Today daily open | 1.3374 |
The pair remains strongly bearish on the daily time frame. It trades below the 20 SMA @ 1.3502, 50 SMA 1.3585, 100 SMA @ 1.3524 and 200 SMA @ 1.3446.
| Trends | Trends.1 | |
|---|---|---|
| 0 | Daily SMA20 | 1.3502 |
| 1 | Daily SMA50 | 1.3585 |
| 2 | Daily SMA100 | 1.3524 |
| 3 | Daily SMA200 | 1.3446 |
The previous day high was 1.3542 while the previous day low was 1.3371. The daily 38.2% Fib levels comes at 1.3436, expected to provide resistance. Similarly, the daily 61.8% fib level is at 1.3476, expected to provide resistance.
Note the levels of interest below:
- Pivot support is noted at 1.3317, 1.3259, 1.3146
- Pivot resistance is noted at 1.3487, 1.3599, 1.3657
| Levels | Levels.1 |
|---|---|
| Previous Daily High | 1.3542 |
| Previous Daily Low | 1.3371 |
| Previous Weekly High | 1.3639 |
| Previous Weekly Low | 1.3371 |
| Previous Monthly High | 1.3668 |
| Previous Monthly Low | 1.3301 |
| Daily Fibonacci 38.2% | 1.3436 |
| Daily Fibonacci 61.8% | 1.3476 |
| Daily Pivot Point S1 | 1.3317 |
| Daily Pivot Point S2 | 1.3259 |
| Daily Pivot Point S3 | 1.3146 |
| Daily Pivot Point R1 | 1.3487 |
| Daily Pivot Point R2 | 1.3599 |
| Daily Pivot Point R3 | 1.3657 |
[/s2If]
Nehcap Expert Advisor
The NEHCAP MT4 EA is high quality professional trading system geared to generate returns without using GRID or martingales. Each trade has strict risk per trade parameter. The pairs under management include EURUSD, GBPUSD, AUDCAD, AUDNZD,GBPAUD, EURAUD, EURCAD, CHFJPY and many more.
The system is trading live: LIVE ACCOUNT TRACKING
You can run it free. Apply for a free trial and track our account. Buy the system or use profit share mechanism to generate returns on your MT4.
Join Our Telegram Group
")


