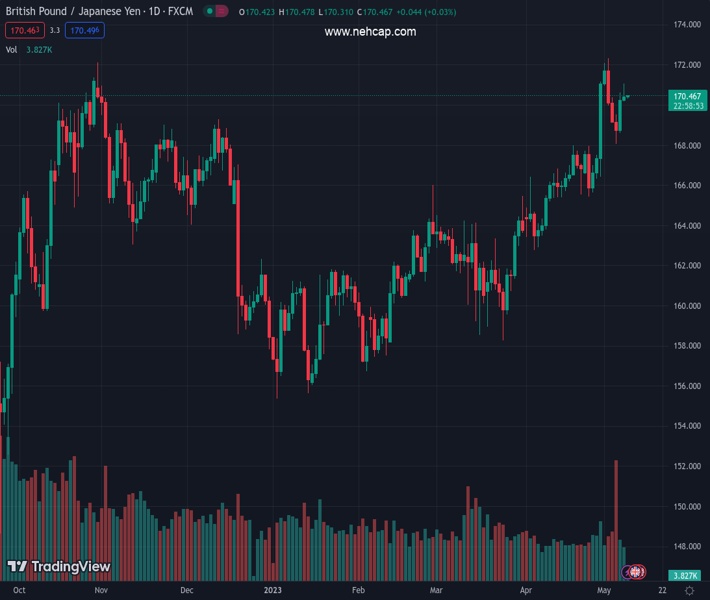
#GBPJPY @ 170.446 The formation of a bullish-engulfing candlestick pattern suggests may continue to trend up. (Pivot Orderbook analysis)
…
This is a premium post.
[s2If !current_user_can(access_s2member_level4)]Please register for FREE REGISTER to read full post below containing analysis. In case of any error or you think you are not able to read the full post below, please email us at support#nehcap.com [lwa][/s2If] [s2If current_user_can(access_s2member_level1)]
- The formation of a bullish-engulfing candlestick pattern suggests GBP/JPY may continue to trend up.
- RSI indicator suggests buyers remain in charge, 3-day RoC climbs from neutral territory.
- GBP/JPY may face resistance at 171.00 and YTD high of 172.33, support at 170.00, and last week’s low of 168.06.
The pair currently trades last at 170.446.
The previous day high was 170.62 while the previous day low was 168.68. The daily 38.2% Fib levels comes at 169.88, expected to provide support. Similarly, the daily 61.8% fib level is at 169.42, expected to provide support.
The GBP/JPY holds to its earlier gains, despite falling from its daily high of 171.07, as risk aversion triggered flows toward safe-haven peers, which bolstered the Japanese Yen (JPY). Nevertheless, it was not enough to turn the cross-currency pair negative, as shown by price action. The GBP/JPY is trading at 170.50, above its opening price by 0.11%.
After completing the formation of a bullish-engulfing candlestick pattern last Friday, the GBP/JPY would likely continue to trend up. Nevertheless, it hit a bump after GBP/JPY’s Monday price action is forming a doji, suggesting indecision amongst GBP/JPY traders.
Although price action would likely remain sideways, the Relative Strength Index (RSI) indicator suggests buyers remain in charge. While the 3-day Rate of Change (RoC) climbed from the neutral territory, showing buyers are moving in.
If GBP/JPY remains in an uptrend, the first resistance level would be 171.00. A breach of the latter will expose the YTD high of 172.33, followed by the 173.00 mark.
Conversely, if GBP/JPY sellers outpace buyers, the first support would be 170.00. Once cleared, the GBP/JPY could test the last week’s low of 168.06, followed by the intersection of the April 25 daily low and the 50-day EMA at around 165.43/60, respectively.
Technical Levels: Supports and Resistances
GBPJPY currently trading at 170.46 at the time of writing. Pair opened at 170.34 and is trading with a change of 0.07 % .
| Overview | Overview.1 | |
|---|---|---|
| 0 | Today last price | 170.46 |
| 1 | Today Daily Change | 0.12 |
| 2 | Today Daily Change % | 0.07 |
| 3 | Today daily open | 170.34 |
The pair remains strongly bullish on the daily timeframe. It trades above its 20 SMA @ 167.69, 50 SMA 164.69, 100 SMA @ 162.39 and 200 SMA @ 163.51.
| Trends | Trends.1 | |
|---|---|---|
| 0 | Daily SMA20 | 167.69 |
| 1 | Daily SMA50 | 164.69 |
| 2 | Daily SMA100 | 162.39 |
| 3 | Daily SMA200 | 163.51 |
The previous day high was 170.62 while the previous day low was 168.68. The daily 38.2% Fib levels comes at 169.88, expected to provide support. Similarly, the daily 61.8% fib level is at 169.42, expected to provide support.
Note the levels of interest below:
- Pivot support is noted at 169.14, 167.94, 167.19
- Pivot resistance is noted at 171.08, 171.82, 173.02
| Levels | Levels.1 |
|---|---|
| Previous Daily High | 170.62 |
| Previous Daily Low | 168.68 |
| Previous Weekly High | 172.34 |
| Previous Weekly Low | 168.06 |
| Previous Monthly High | 171.18 |
| Previous Monthly Low | 162.78 |
| Daily Fibonacci 38.2% | 169.88 |
| Daily Fibonacci 61.8% | 169.42 |
| Daily Pivot Point S1 | 169.14 |
| Daily Pivot Point S2 | 167.94 |
| Daily Pivot Point S3 | 167.19 |
| Daily Pivot Point R1 | 171.08 |
| Daily Pivot Point R2 | 171.82 |
| Daily Pivot Point R3 | 173.02 |
[/s2If]
Nehcap Expert Advisor
The NEHCAP MT4 EA is high quality professional trading system geared to generate returns without using GRID or martingales. Each trade has strict risk per trade parameter. The pairs under management include EURUSD, GBPUSD, AUDCAD, AUDNZD,GBPAUD, EURAUD, EURCAD, CHFJPY and many more.
The system is trading live: LIVE ACCOUNT TRACKING
You can run it free. Apply for a free trial and track our account. Buy the system or use profit share mechanism to generate returns on your MT4.
Join Our Telegram Group
")


