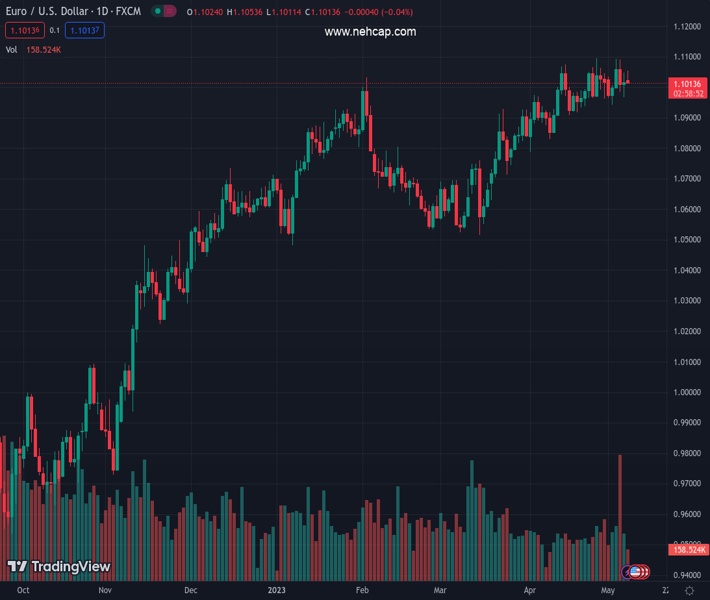
#EURUSD @ 1.10142 trading at 1.1027, holding to gains of 0.13% despite the Eurozone Industrial Production plunge. (Pivot Orderbook analysis)
…
This is a premium post.
[s2If !current_user_can(access_s2member_level4)]Please register for FREE REGISTER to read full post below containing analysis. In case of any error or you think you are not able to read the full post below, please email us at support#nehcap.com [lwa][/s2If] [s2If current_user_can(access_s2member_level1)]
- EUR/USD trading at 1.1027, holding to gains of 0.13% despite the Eurozone Industrial Production plunge.
- Dutch Central Bank President comments on the need for rate hikes to curb inflation.
- US Treasury Secretary Yellen states no favorable alternatives to resolve the debt limit issue without Congress’s assistance.
The pair currently trades last at 1.10142.
The previous day high was 1.1048 while the previous day low was 1.0967. The daily 38.2% Fib levels comes at 1.1017, expected to provide resistance. Similarly, the daily 61.8% fib level is at 1.0998, expected to provide support.
The EUR/USD retreated from daily highs, hitting 1.1053 as the European session ended. The latest week, we have witnessed the US Federal Reserve (Fed) and the European Central Bank (ECB) increasing rates by 25 bps, though divergence would likely favor the latter. Hence, the EUR/USD is trading at 1.1017, with losses of 0.05%.
US equities continued to trade mixed. The EUR/USD pair is clinging to its earlier gains, despite data from the Eurozone (EU), namely Germany, showing that Industrial Production plunged in March to -3.4%, below the -1.3% contraction expected by the consensus. That, alongside the last week, Germany’s Industrial Orders plummeting 10.7% MoM, has raised recessionary fears amongst the EU.
In the meantime, some ECB officials embarked on hawkish remarks, with Dutch Central Bank President Klaas Knot saying that rate hikes are starting to have an effect, but more are needed to curb inflation. Of late, the ECB’s Chief Economist, Philip Lane, commented that inflation will come down, but momentum is still high.
On the US front, the debt ceiling narrative has taken center stage. According to Janet Yellen, the US Treasury Secretary, there are no favorable alternatives to resolve the debt limit issue in Washington without assistance from the US Congress. In the meantime, US President Joe Biden is expected to meet lawmakers on May 9 to advance in negotiations regarding raising the ceiling.
The US economic docket revealed that Wholesale Inventories were unchanged in March, below estimates of 0.1% MoM, the US Department of Commerce said. Annually based, inventories jumped 9.1% in March, despite the first quarter decline, as more robust US consumer spending contributed to the inventory rundown.
The daily chart’s EUR/USD price action suggests buyers remain in the driver’s seat. Of note is that while the EUR/USD pair is reaching higher highs, the Relative Strength Index (RSI) indicator is not, as it has recorded a successive series of lower peaks. Therefore, a negative divergence between price action and the oscillator is emerging, which could pave the way for further losses. However, the EUR/USD must fall below 1.1000 first, so it can challenge the May 2 daily low of 1.0942. before dropping toward the 1.0900 figure. A breach of the latter will expose the 50-day EMA At 1.0883. Conversely, if EUR/USD buyers reclaim 1.1100, that would keep the EUR/USD uptrend intact.
Technical Levels: Supports and Resistances
EURUSD currently trading at 1.1018 at the time of writing. Pair opened at 1.102 and is trading with a change of -0.02 % .
| Overview | Overview.1 | |
|---|---|---|
| 0 | Today last price | 1.1018 |
| 1 | Today Daily Change | -0.0002 |
| 2 | Today Daily Change % | -0.0200 |
| 3 | Today daily open | 1.1020 |
The pair remains strongly bullish on the daily timeframe. It trades above its 20 SMA @ 1.0989, 50 SMA 1.0839, 100 SMA @ 1.0782 and 200 SMA @ 1.0434.
| Trends | Trends.1 | |
|---|---|---|
| 0 | Daily SMA20 | 1.0989 |
| 1 | Daily SMA50 | 1.0839 |
| 2 | Daily SMA100 | 1.0782 |
| 3 | Daily SMA200 | 1.0434 |
The previous day high was 1.1048 while the previous day low was 1.0967. The daily 38.2% Fib levels comes at 1.1017, expected to provide resistance. Similarly, the daily 61.8% fib level is at 1.0998, expected to provide support.
Note the levels of interest below:
- Pivot support is noted at 1.0975, 1.0931, 1.0894
- Pivot resistance is noted at 1.1056, 1.1093, 1.1137
| Levels | Levels.1 |
|---|---|
| Previous Daily High | 1.1048 |
| Previous Daily Low | 1.0967 |
| Previous Weekly High | 1.1092 |
| Previous Weekly Low | 1.0942 |
| Previous Monthly High | 1.1095 |
| Previous Monthly Low | 1.0788 |
| Daily Fibonacci 38.2% | 1.1017 |
| Daily Fibonacci 61.8% | 1.0998 |
| Daily Pivot Point S1 | 1.0975 |
| Daily Pivot Point S2 | 1.0931 |
| Daily Pivot Point S3 | 1.0894 |
| Daily Pivot Point R1 | 1.1056 |
| Daily Pivot Point R2 | 1.1093 |
| Daily Pivot Point R3 | 1.1137 |
[/s2If]
Nehcap Expert Advisor
The NEHCAP MT4 EA is high quality professional trading system geared to generate returns without using GRID or martingales. Each trade has strict risk per trade parameter. The pairs under management include EURUSD, GBPUSD, AUDCAD, AUDNZD,GBPAUD, EURAUD, EURCAD, CHFJPY and many more.
The system is trading live: LIVE ACCOUNT TRACKING
You can run it free. Apply for a free trial and track our account. Buy the system or use profit share mechanism to generate returns on your MT4.
Join Our Telegram Group
")


