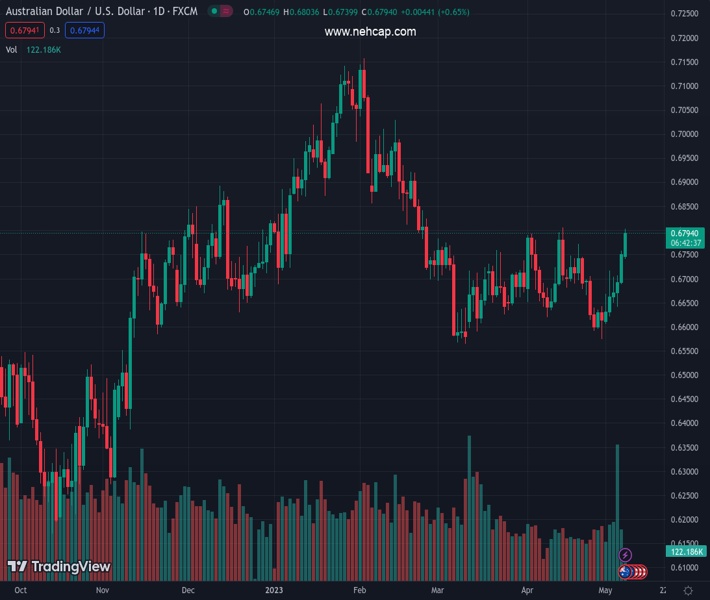
#AUDUSD @ 0.67983 scales higher for the sixth straight day and climbs to its highest level since February 24. (Pivot Orderbook analysis)
…
This is a premium post.
[s2If !current_user_can(access_s2member_level4)]Please register for FREE REGISTER to read full post below containing analysis. In case of any error or you think you are not able to read the full post below, please email us at support#nehcap.com [lwa][/s2If] [s2If current_user_can(access_s2member_level1)]
- AUD/USD scales higher for the sixth straight day and climbs to its highest level since February 24.
- The RBA’s hawkish bias continues to underpin the Aussie and remains supportive amid a weaker USD.
- A sustained move beyond the 100-day SMA should set the stage for a further appreciating move.
The pair currently trades last at 0.67983.
The previous day high was 0.6757 while the previous day low was 0.6689. The daily 38.2% Fib levels comes at 0.6731, expected to provide support. Similarly, the daily 61.8% fib level is at 0.6715, expected to provide support.
The AUD/USD pair gains strong follow-through traction for the sixth successive day on Monday and prolongs the momentum through the early North American session. Spot prices reclaim the 0.6800 mark for the first time since February 24, with bulls making a fresh attempt to build on the strength further beyond the 100-day Simple Moving Average (SMA).
The Australian Dollar (AUD) continues to draw support from the Reserve Bank of Australia’s (RBA) surprise 25-basis-points interest-rate hike last week and a more hawkish outlook. Adding to this, the RBA’s Statement of Monetary Policy (SoMP) released on Friday highlighted that risks for inflation were tilted on the upside and that a further tightening of monetary policy may be required to ensure that inflation returns to target. This, along with a modest US Dollar (USD) weakness, provides an additional boost to the AUD/USD pair and remains supportive of the ongoing positive move.
In fact, the USD Index (DXY), which tracks the Greenback against a basket of currencies, languishes near the monthly low amid growing acceptance that the Federal Reserve (Fed) is approaching the end of its rate-hiking cycles. The Fed Fund futures point to a 90% probability that the US central bank will hold interest rates steady in June. Moreover, the markets have also started pricing in the possibility that the Fed beginning cutting rates in the second half of this year. This, along with worries about a full-blown banking crisis and the US debt ceiling, continues to exert downward pressure on the USD.
Apart from this, the risk-on impulse – as depicted by a generally positive tone around the equity markets – further undermines the safe-haven Greenback and benefits the risk-sensitive Aussie. That said, a goodish intraday pickup in the US Treasury bond yields acts as a tailwind for the USD and could cap gains for the AUD/USD pair in the absence of any relevant economic data from the US. Traders now look to the Australian Retail Sales data and Chinese Trade Balance figures for some impetus during the Asian session on Tuesday, though the focus remains on the US CPI report on Wednesday.
Technical Levels: Supports and Resistances
AUDUSD currently trading at 0.6798 at the time of writing. Pair opened at 0.6749 and is trading with a change of 0.73 % .
| Overview | Overview.1 | |
|---|---|---|
| 0 | Today last price | 0.6798 |
| 1 | Today Daily Change | 0.0049 |
| 2 | Today Daily Change % | 0.7300 |
| 3 | Today daily open | 0.6749 |
The pair remains strongly bullish on the daily timeframe. It trades above its 20 SMA @ 0.6681, 50 SMA 0.6684, 100 SMA @ 0.6788 and 200 SMA @ 0.6729.
| Trends | Trends.1 | |
|---|---|---|
| 0 | Daily SMA20 | 0.6681 |
| 1 | Daily SMA50 | 0.6684 |
| 2 | Daily SMA100 | 0.6788 |
| 3 | Daily SMA200 | 0.6729 |
The previous day high was 0.6757 while the previous day low was 0.6689. The daily 38.2% Fib levels comes at 0.6731, expected to provide support. Similarly, the daily 61.8% fib level is at 0.6715, expected to provide support.
Note the levels of interest below:
- Pivot support is noted at 0.6707, 0.6664, 0.6639
- Pivot resistance is noted at 0.6774, 0.6799, 0.6842
| Levels | Levels.1 |
|---|---|
| Previous Daily High | 0.6757 |
| Previous Daily Low | 0.6689 |
| Previous Weekly High | 0.6757 |
| Previous Weekly Low | 0.6607 |
| Previous Monthly High | 0.6806 |
| Previous Monthly Low | 0.6574 |
| Daily Fibonacci 38.2% | 0.6731 |
| Daily Fibonacci 61.8% | 0.6715 |
| Daily Pivot Point S1 | 0.6707 |
| Daily Pivot Point S2 | 0.6664 |
| Daily Pivot Point S3 | 0.6639 |
| Daily Pivot Point R1 | 0.6774 |
| Daily Pivot Point R2 | 0.6799 |
| Daily Pivot Point R3 | 0.6842 |
[/s2If]
Nehcap Expert Advisor
The NEHCAP MT4 EA is high quality professional trading system geared to generate returns without using GRID or martingales. Each trade has strict risk per trade parameter. The pairs under management include EURUSD, GBPUSD, AUDCAD, AUDNZD,GBPAUD, EURAUD, EURCAD, CHFJPY and many more.
The system is trading live: LIVE ACCOUNT TRACKING
You can run it free. Apply for a free trial and track our account. Buy the system or use profit share mechanism to generate returns on your MT4.
Join Our Telegram Group
")


