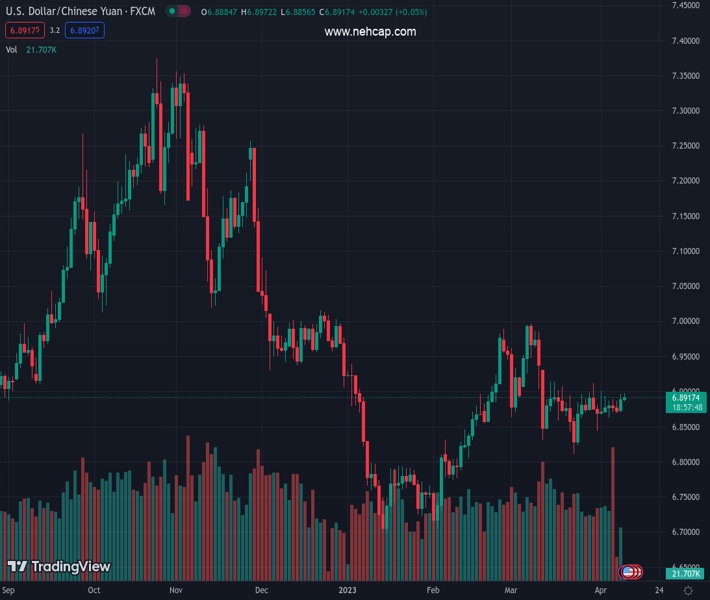
#USDCNH @ 6.89235 renews intraday high as China inflation data deteriorates in March. (Pivot Orderbook analysis)
…
This is a premium post.
[s2If !current_user_can(access_s2member_level4)]Please register for PREMIUM VERSION HERE to read full post below containing analysis. In case of any error or you think you are not able to read the full post below, please email us at support#nehcap.com [lwa][/s2If] [s2If current_user_can(access_s2member_level4)]
- USD/CNH renews intraday high as China inflation data deteriorates in March.
- China’s headline CPI eases to 0.7% YoY while PPI drops further to -2.5% YoY.
- Friday’s upbeat US data allow Fed hawks to expect 0.25% rate hike in May.
- US-China tension over Taiwan, full markets eyed for intraday directions.
The pair currently trades last at 6.89235.
The previous day high was 6.8958 while the previous day low was 6.8728. The daily 38.2% Fib levels comes at 6.8871, expected to provide support. Similarly, the daily 61.8% fib level is at 6.8816, expected to provide support.
USD/CNH justifies downbeat China inflation data as it refreshed intraday high to near 6.8975 following the data release on early Tuesday. In doing so, the offshore Chinese Yuan (CNH) pair also respects the hawkish concerns about the Federal Reserve (Fed) as full markets return after an extended weekend.
China’s headline inflation numbers for March, namely the Consumer Price Index (CPI) and Producer Price Index (PPI), came in 0.7% YoY and -2.5% YoY versus 1.0% and -1.4% respective priors.
Also read: China’s CPI softens to 0.7% YoY in March vs. 1.0% expected
It’s worth noting that optimism surrounding China’s growth conditions seems to challenge the USD/CNH buyers of late. International Monetary Fund’s (IMF) Managing Director Kristalina Georgieva said that “the global economy is estimated to grow less than 3% in 2023, with India and China expected to account for half of the global growth this year.
Even so, Friday’s upbeat US employment data joins the market’s rejection of recession woes to underpin the hawkish Fed bets and propel the USD/CNH prices amid cautious optimism in the markets.
While portraying the same, CME’s FedWatch Tool suggests a 72% chance of the Fed’s 0.25% rate hike in May, versus 57% odds favoring the same in the last week.
Earlier in Asia, USD/CNH marked losses amid mixed talks of the US Federal Reserve’s (Fed) next move joining headlines suggesting China’s end to the military strikes near Taiwan.
Federal Reserve (Fed) Bank of New York President, as well as the Fed’s Vice Chairman of the rate-setting committee, John Williams anticipated slower inflation while ruling out the interest rates as culprits for the previous month’s bank fallouts. On the same line, Rick Rieder, Chief Investment Officer of global fixed income at BlackRock, the world’s largest asset manager, said late Monday, “The Federal Reserve may not need to raise interest rates further to fight inflation, as the fallout from last month’s turmoil in the banking sector and a series of recent labor data point to a slowing US economy,” per Reuters.
Reuters cites the end of China’s military drills while saying, “China ended three days of military drills around Taiwan on Monday saying they had tested integrated military capabilities under actual combat conditions, having practiced precision strikes and blockading the island that Beijing views as its own.”
Moving on, the risk catalysts and the trading moves amid full markets can direct USD/CNH traders ahead of Wednesday’s US CPI and Fed Minutes.
A three-week-old ascending triangle, currently between 6.9140 and 6.8820, restricts short-term USD/CNH moves.
Technical Levels: Supports and Resistances
USDCNH currently trading at 6.8914 at the time of writing. Pair opened at 6.8928 and is trading with a change of -0.02% % .
| Overview | Overview.1 | |
|---|---|---|
| 0 | Today last price | 6.8914 |
| 1 | Today Daily Change | -0.0014 |
| 2 | Today Daily Change % | -0.02% |
| 3 | Today daily open | 6.8928 |
The pair is trading above its 20 Daily moving average @ 6.8777, above its 50 Daily moving average @ 6.8738 , below its 100 Daily moving average @ 6.9007 and below its 200 Daily moving average @ 6.942
| Trends | Trends.1 | |
|---|---|---|
| 0 | Daily SMA20 | 6.8777 |
| 1 | Daily SMA50 | 6.8738 |
| 2 | Daily SMA100 | 6.9007 |
| 3 | Daily SMA200 | 6.9420 |
The previous day high was 6.8958 while the previous day low was 6.8728. The daily 38.2% Fib levels comes at 6.8871, expected to provide support. Similarly, the daily 61.8% fib level is at 6.8816, expected to provide support.
Note the levels of interest below:
- Pivot support is noted at 6.8785, 6.8642, 6.8555
- Pivot resistance is noted at 6.9015, 6.9102, 6.9245
| Levels | Levels.1 |
|---|---|
| Previous Daily High | 6.8958 |
| Previous Daily Low | 6.8728 |
| Previous Weekly High | 6.9006 |
| Previous Weekly Low | 6.8630 |
| Previous Monthly High | 6.9970 |
| Previous Monthly Low | 6.8104 |
| Daily Fibonacci 38.2% | 6.8871 |
| Daily Fibonacci 61.8% | 6.8816 |
| Daily Pivot Point S1 | 6.8785 |
| Daily Pivot Point S2 | 6.8642 |
| Daily Pivot Point S3 | 6.8555 |
| Daily Pivot Point R1 | 6.9015 |
| Daily Pivot Point R2 | 6.9102 |
| Daily Pivot Point R3 | 6.9245 |
[/s2If]
Join Our Telegram Group
")


