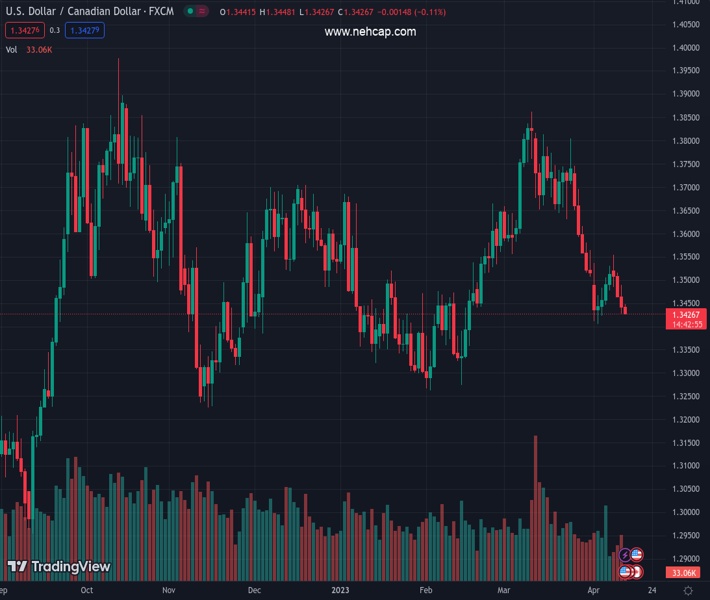
#USDCAD @ 1.34953 takes offers to refresh intraday low, extend the previous day’s pullback from monthly high. (Pivot Orderbook analysis)
…
This is a premium post.
[s2If !current_user_can(access_s2member_level4)]Please register for PREMIUM VERSION HERE to read full post below containing analysis. In case of any error or you think you are not able to read the full post below, please email us at support#nehcap.com [lwa][/s2If] [s2If current_user_can(access_s2member_level4)]
- USD/CAD takes offers to refresh intraday low, extend the previous day’s pullback from monthly high.
- Receding fears of recession, banking fallouts underpin mildly positive sentiment.
- Fed talks, concerns about easy rate hikes prod US Dollar bulls, as well as propel WTI crude oil.
- Risk catalysts eyed ahead of the all-important Wednesday.
The pair currently trades last at 1.34953.
The previous day high was 1.3554 while the previous day low was 1.3485. The daily 38.2% Fib levels comes at 1.3511, expected to provide resistance. Similarly, the daily 61.8% fib level is at 1.3528, expected to provide resistance.
USD/CAD drops to 1.3490 as it renews its intraday low during early Tuesday, extending the previous day’s pullback from a seven-day high.
In doing so, the Loonie pair justifies the US Dollar’s pullback amid mildly positive sentiment. Adding strength to the USD/CAD fall could be the recent recovery in WTI crude oil prices, as well as the Canadian Dollar’s (CAD) preparations for Wednesday’s Bank of Canada (BoC) Monetary Policy announcements.
That said, the US Dollar Index (DXY) eases to 102.40 while printing the first daily loss in five. On the other hand, the US 10-year and two-year Treasury bond yields retreat to 3.40% and 3.99% at the latest while the S&P 500 Futures print mild gains around 4,143 at the latest.
Underpinning the firmer risk appetite are mixed talks of the US Federal Reserve’s (Fed) next move joining headlines suggesting China’s end to the military strikes near Taiwan. It should be noted that the Federal Reserve (Fed) Bank of New York President, as well as the Fed’s Vice Chairman of the rate-setting committee, John Williams anticipated slower inflation while ruling out the interest rates as culprits for the previous month’s bank fallouts. On the same line, Rick Rieder, Chief Investment Officer of global fixed income at BlackRock, the world’s largest asset manager, said late Monday, “The Federal Reserve may not need to raise interest rates further to fight inflation, as the fallout from last month’s turmoil in the banking sector and a series of recent labor data point to a slowing US economy,” per Reuters.
On the other hand, Reuters cites the end of China’s military drills while saying, “China ended three days of military drills around Taiwan on Monday saying they had tested integrated military capabilities under actual combat conditions, having practiced precision strikes and blockading the island that Beijing views as its own.”
That said, WTI crude oil rises half a percent to $80.30 while making rounds to a 10-week-old trading range of around $79.65 and $81.70. While seeking clues for the latest WTI rebound, chatters about the optimistic Japan and China concerns gain major attention. Recently, legendary investor Warren Buffet signals to invest in Japanese stocks while the International Monetary Fund (IMF) suggests higher growth in Asia to lead the global economy. International Monetary Fund’s (IMF) Managing Director Kristalina Georgieva said that “the global economy is estimated to grow less than 3% in 2023, with India and China expected to account for half of the global growth this year.
Looking forward, USD/CAD is likely to remain depressed as full markets brace for the dovish BoC outcome. However, softer US inflation and a likely hesitance to favor further rate hikes in the Fed Minutes may allow the Loonie pair bears to keep the reins.
Repeated failures to cross the 50-DMA hurdle of 1.3560 keeps USD/CAD bears hopeful of witnessing further downside.
Technical Levels: Supports and Resistances
USDCAD currently trading at 1.3491 at the time of writing. Pair opened at 1.3509 and is trading with a change of -0.13% % .
| Overview | Overview.1 | |
|---|---|---|
| 0 | Today last price | 1.3491 |
| 1 | Today Daily Change | -0.0018 |
| 2 | Today Daily Change % | -0.13% |
| 3 | Today daily open | 1.3509 |
The pair is trading below its 20 Daily moving average @ 1.361, below its 50 Daily moving average @ 1.3557 , below its 100 Daily moving average @ 1.3529 and above its 200 Daily moving average @ 1.3393
| Trends | Trends.1 | |
|---|---|---|
| 0 | Daily SMA20 | 1.3610 |
| 1 | Daily SMA50 | 1.3557 |
| 2 | Daily SMA100 | 1.3529 |
| 3 | Daily SMA200 | 1.3393 |
The previous day high was 1.3554 while the previous day low was 1.3485. The daily 38.2% Fib levels comes at 1.3511, expected to provide resistance. Similarly, the daily 61.8% fib level is at 1.3528, expected to provide resistance.
Note the levels of interest below:
- Pivot support is noted at 1.3478, 1.3447, 1.3409
- Pivot resistance is noted at 1.3547, 1.3585, 1.3616
| Levels | Levels.1 |
|---|---|
| Previous Daily High | 1.3554 |
| Previous Daily Low | 1.3485 |
| Previous Weekly High | 1.3537 |
| Previous Weekly Low | 1.3406 |
| Previous Monthly High | 1.3862 |
| Previous Monthly Low | 1.3508 |
| Daily Fibonacci 38.2% | 1.3511 |
| Daily Fibonacci 61.8% | 1.3528 |
| Daily Pivot Point S1 | 1.3478 |
| Daily Pivot Point S2 | 1.3447 |
| Daily Pivot Point S3 | 1.3409 |
| Daily Pivot Point R1 | 1.3547 |
| Daily Pivot Point R2 | 1.3585 |
| Daily Pivot Point R3 | 1.3616 |
[/s2If]
Join Our Telegram Group
")


