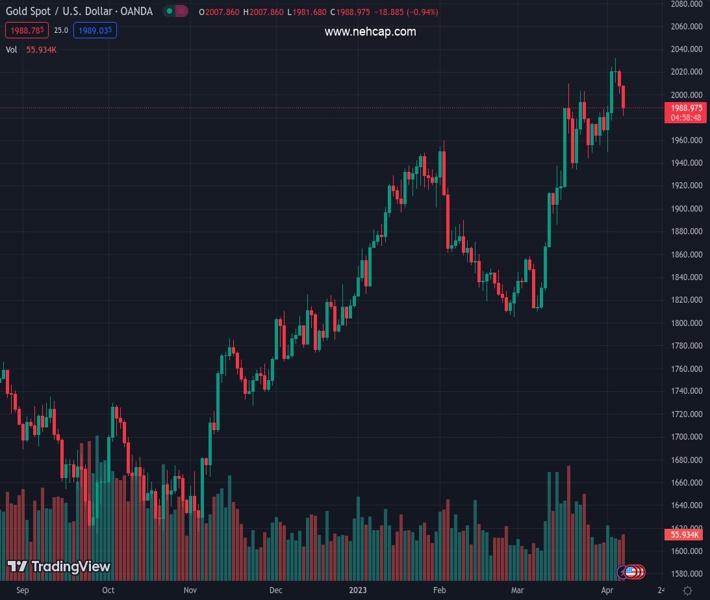
#XAUUSD @ 1,988.93 US Dollar accelerates its recovery on Monday after a long weekend. (Pivot Orderbook analysis)
…
This is a premium post.
[s2If !current_user_can(access_s2member_level4)]Please register for PREMIUM VERSION HERE to read full post below containing analysis. In case of any error or you think you are not able to read the full post below, please email us at support#nehcap.com [lwa][/s2If] [s2If current_user_can(access_s2member_level4)]
- US Dollar accelerates its recovery on Monday after a long weekend.
- US yields move higher following NFP, ahead of US CPI.
- XAU/USD fails to hold above $2,000; extends correction from monthly highs.
The pair currently trades last at 1988.93.
The previous day high was 2021.5 while the previous day low was 2000.93. The daily 38.2% Fib levels comes at 2008.79, expected to provide resistance. Similarly, the daily 61.8% fib level is at 2013.64, expected to provide resistance.
Gold price is falling by more than 1% on Monday following Friday’s NFP and ahead of crucial US consumer inflation numbers. XAU/USD printed a fresh six-day low near $1,980 and then trimmed losses.
A stronger US Dollar and higher US yield weigh on the yellow metal. The US Dollar Index is having the biggest daily gain in weeks and trades at 102.75. At the same time, the US 10-year bond yield is at 3.43%, and the 2-year is back at 4.00%.
XAU/USD bottomed at $1,981, the lowest level since last Tuesday. It is hovering below $1,990, with a bearish bias in the short term, extending the correction from the recent top at $2,031.
The metal remains depressed after breaking a relevant short-term uptrend line and also after pulling back under $2,000. The primary trend is bullish and the price holds above key moving averages in the daily chart. The 20-day Simple Moving Average awaits at $1,967.
If XAU/USD rises back above $2,000, it could recover momentum. The next resistance stands at $2,010, followed by $2,022.
Technical Levels: Supports and Resistances
XAUUSD currently trading at 1989.31 at the time of writing. Pair opened at 2007.82 and is trading with a change of -0.92 % .
| Overview | Overview.1 | |
|---|---|---|
| 0 | Today last price | 1989.31 |
| 1 | Today Daily Change | -18.51 |
| 2 | Today Daily Change % | -0.92 |
| 3 | Today daily open | 2007.82 |
The pair remains strongly bullish on the daily timeframe. It trades above its 20 SMA @ 1962.7, 50 SMA 1898.83, 100 SMA @ 1862.26 and 200 SMA @ 1787.74.
| Trends | Trends.1 | |
|---|---|---|
| 0 | Daily SMA20 | 1962.70 |
| 1 | Daily SMA50 | 1898.83 |
| 2 | Daily SMA100 | 1862.26 |
| 3 | Daily SMA200 | 1787.74 |
The previous day high was 2021.5 while the previous day low was 2000.93. The daily 38.2% Fib levels comes at 2008.79, expected to provide resistance. Similarly, the daily 61.8% fib level is at 2013.64, expected to provide resistance.
Note the levels of interest below:
- Pivot support is noted at 1998.67, 1989.51, 1978.1
- Pivot resistance is noted at 2019.24, 2030.65, 2039.81
| Levels | Levels.1 |
|---|---|
| Previous Daily High | 2021.50 |
| Previous Daily Low | 2000.93 |
| Previous Weekly High | 2032.11 |
| Previous Weekly Low | 1949.83 |
| Previous Monthly High | 2009.88 |
| Previous Monthly Low | 1809.46 |
| Daily Fibonacci 38.2% | 2008.79 |
| Daily Fibonacci 61.8% | 2013.64 |
| Daily Pivot Point S1 | 1998.67 |
| Daily Pivot Point S2 | 1989.51 |
| Daily Pivot Point S3 | 1978.10 |
| Daily Pivot Point R1 | 2019.24 |
| Daily Pivot Point R2 | 2030.65 |
| Daily Pivot Point R3 | 2039.81 |
[/s2If]
Join Our Telegram Group
")


