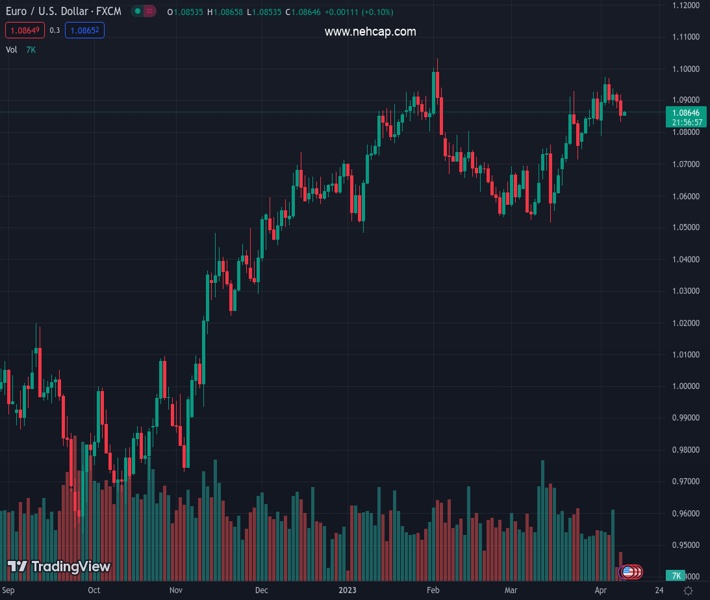
#EURUSD @ 1.08650 has jumped above the critical resistance of 1.0860 amid a correction in the USD Index. (Pivot Orderbook analysis)
…
This is a premium post.
[s2If !current_user_can(access_s2member_level4)]Please register for PREMIUM VERSION HERE to read full post below containing analysis. In case of any error or you think you are not able to read the full post below, please email us at support#nehcap.com [lwa][/s2If] [s2If current_user_can(access_s2member_level4)]
- EUR/USD has jumped above the critical resistance of 1.0860 amid a correction in the USD Index.
- Fed Williams is anticipating inflation at 3.75% and a growth rate of less than 1% this year.
- A contraction in Eurozone Retail Sales is insufficient to back a neutral stance from the ECB.
The pair currently trades last at 1.08650.
The previous day high was 1.0924 while the previous day low was 1.0876. The daily 38.2% Fib levels comes at 1.0895, expected to provide resistance. Similarly, the daily 61.8% fib level is at 1.0906, expected to provide resistance.
The EUR/USD pair has climbed above the immediate resistance of 1.0860 in the early Asian session. The shared currency pair rebounded firmly after buying interest above 1.0830 in the early New York session. A corrective move in the US Dollar Index (DXY) resulted in a recovery in the Euro after a sheer sell-off.
The downside bias for the major currency pair has not been over yet as investors are anticipating a hawkish stance from the Federal Reserve (Fed) for its next month’s monetary policy.
S&P500 futures showed a stellar recovery on Monday after a gap-down opening despite anxiety among investors ahead of result season. The street is worried about the earnings of commercial banks after the banking fiasco due to the collapse of Silicon Valley Bank (SVB) and Signature Bank. Also, tight credit conditions by US banks must have impacted advances needed by firms for fixed capital working capital management.
The US Dollar Index (DXY) registered a gradual correction to near 102.54 as investors ignored China-Taiwan tensions despite the continuation of drilling by the Chinese military around Taiwan Island.
The major trigger that will keep investors busy ahead is the United States Consumer Price Index (CPI) data, which will release on Wednesday. Analysts at TD Securities expect the headline inflation to rise by 0.1% in March, and the core CPI by 0.4%. They see the CPI slowing to 3.6% by the fourth quarter.
Also, the commentary from New York Fed Bank president John C. Williams conveys, Inflation will be around 3.75% this year. He further added that the growth rate will be less than 1% and the Unemployment Rate will gradually rise to 4-4.5%. On banking turmoil, Fed Williams believes that higher rates by the Fed were not the cause of recent banking stress.
On the Eurozone front, investors are awaiting the Retail Sales data for fresh impetus. Monthly Retail Sales (March) are expected to contract by 0.8% vs. an expansion of 0.3% recorded in February. And annual Retail Sales would contract further to 3.5% from a prior contraction of 2.3%.
This might delight the European Central Bank (ECB) but is not sufficient to back a neutral stance for upcoming monetary policy meeting.
Technical Levels: Supports and Resistances
EURUSD currently trading at 1.0863 at the time of writing. Pair opened at 1.0904 and is trading with a change of -0.38 % .
| Overview | Overview.1 | |
|---|---|---|
| 0 | Today last price | 1.0863 |
| 1 | Today Daily Change | -0.0041 |
| 2 | Today Daily Change % | -0.3800 |
| 3 | Today daily open | 1.0904 |
The pair remains strongly bullish on the daily timeframe. It trades above its 20 SMA @ 1.0803, 50 SMA 1.0735, 100 SMA @ 1.0679 and 200 SMA @ 1.0352.
| Trends | Trends.1 | |
|---|---|---|
| 0 | Daily SMA20 | 1.0803 |
| 1 | Daily SMA50 | 1.0735 |
| 2 | Daily SMA100 | 1.0679 |
| 3 | Daily SMA200 | 1.0352 |
The previous day high was 1.0924 while the previous day low was 1.0876. The daily 38.2% Fib levels comes at 1.0895, expected to provide resistance. Similarly, the daily 61.8% fib level is at 1.0906, expected to provide resistance.
Note the levels of interest below:
- Pivot support is noted at 1.0879, 1.0854, 1.0831
- Pivot resistance is noted at 1.0927, 1.0949, 1.0975
| Levels | Levels.1 |
|---|---|
| Previous Daily High | 1.0924 |
| Previous Daily Low | 1.0876 |
| Previous Weekly High | 1.0973 |
| Previous Weekly Low | 1.0788 |
| Previous Monthly High | 1.0930 |
| Previous Monthly Low | 1.0516 |
| Daily Fibonacci 38.2% | 1.0895 |
| Daily Fibonacci 61.8% | 1.0906 |
| Daily Pivot Point S1 | 1.0879 |
| Daily Pivot Point S2 | 1.0854 |
| Daily Pivot Point S3 | 1.0831 |
| Daily Pivot Point R1 | 1.0927 |
| Daily Pivot Point R2 | 1.0949 |
| Daily Pivot Point R3 | 1.0975 |
[/s2If]
Join Our Telegram Group
")


