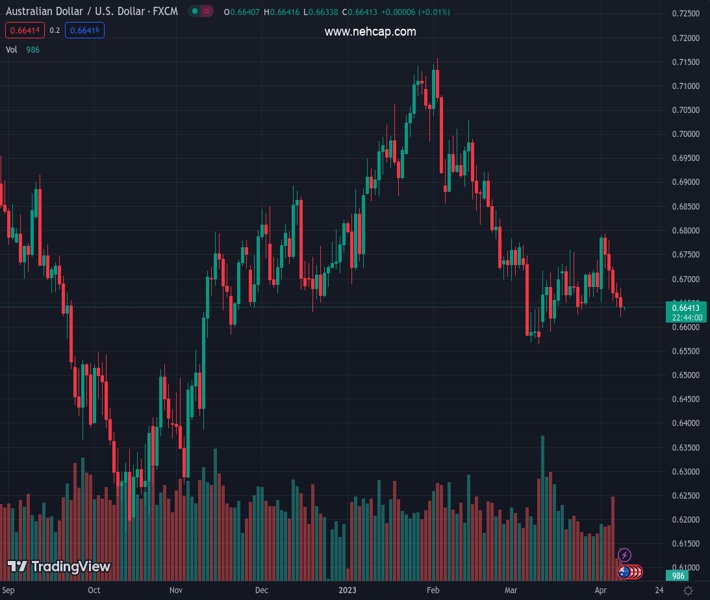
#AUDUSD @ 0.66401 remains depressed around three-week low, stays bearish after five-day downtrend. (Pivot Orderbook analysis)
…
This is a premium post.
[s2If !current_user_can(access_s2member_level4)]Please register for PREMIUM VERSION HERE to read full post below containing analysis. In case of any error or you think you are not able to read the full post below, please email us at support#nehcap.com [lwa][/s2If] [s2If current_user_can(access_s2member_level4)]
- AUD/USD remains depressed around three-week low, stays bearish after five-day downtrend.
- Recovery in US Treasury bond yields joins US-China tension and RBA-inflicted bearish bias to weigh on Aussie prices.
- Australia Westpac Consumer Confidence, China inflation numbers eyed for fresh impulse.
The pair currently trades last at 0.66401.
The previous day high was 0.6691 while the previous day low was 0.6641. The daily 38.2% Fib levels comes at 0.6672, expected to provide resistance. Similarly, the daily 61.8% fib level is at 0.666, expected to provide resistance.
AUD/USD holds lower grounds near 0.6640 after declining in the last five consecutive days. In doing so, the Aussie pair not only justifies its risk barometer status but also respects the US Dollar’s broad recovery amid firmer yields, as well as the Reserve Bank of Australia (RBA) induced bearish bias.
That said, the previous Friday’s US employment numbers renew hawkish bets on the Federal Reserve’s (Fed) next rate hike of 0.25% in May and allowed the US Treasury yields to recover. As a result, the US 10-year and two-year Treasury bond yields rose to 3.41% and 4.0% at the latest.
US Dollar Index (DXY) traced yields towards the north and rose for the fourth day in a row while poking a one-week high on Monday, around 102.55 by the press time.
It’s worth noting that the receding fears of the banking crisis in the US and escalating US-China tension joined the firmer US Treasury bond yields to also propel the US Dollar Index, which in turn drowned AUD/USD prices. Furthermore, RBA’s pause to its rate hike trajectory in the last week also exerts downside pressure on the Aussie pair.
Amid these plays, Wall Street benchmarks closed mixed, with minor moves, whereas the other riskier assets like commodities and Antipodeans stay depressed of late.
Moving on, AUD/USD pair traders should watch Westpac Consumer Confidence for March ahead of China’s headline inflation numbers for the said month, namely the Consumer Price Index (CPI) and Producer Price Index (PPI). Given the dragon nation’s recent optimism, coupled with the downbeat mood in Australia, any disappointment from the inflation numbers of a major customer won’t be taken lightly by the Aussie pair traders. Above all, Wednesday’s US CPI and Fed Minutes will be crucial ahead of Thursday’s employment data from Canberra.
A clear downside break of the one-month-old ascending support line, now immediate resistance around 0.6700, keeps AUD/USD bears hopeful of visiting the yearly low of around 0.6565.
Technical Levels: Supports and Resistances
AUDUSD currently trading at 0.6641 at the time of writing. Pair opened at 0.6674 and is trading with a change of -0.49% % .
| Overview | Overview.1 | |
|---|---|---|
| 0 | Today last price | 0.6641 |
| 1 | Today Daily Change | -0.0033 |
| 2 | Today Daily Change % | -0.49% |
| 3 | Today daily open | 0.6674 |
The pair remains strongly bearish on the daily time frame. It trades below the 20 SMA @ 0.6688, 50 SMA 0.6784, 100 SMA @ 0.68 and 200 SMA @ 0.6748.
| Trends | Trends.1 | |
|---|---|---|
| 0 | Daily SMA20 | 0.6688 |
| 1 | Daily SMA50 | 0.6784 |
| 2 | Daily SMA100 | 0.6800 |
| 3 | Daily SMA200 | 0.6748 |
The previous day high was 0.6691 while the previous day low was 0.6641. The daily 38.2% Fib levels comes at 0.6672, expected to provide resistance. Similarly, the daily 61.8% fib level is at 0.666, expected to provide resistance.
Note the levels of interest below:
- Pivot support is noted at 0.6646, 0.6618, 0.6596
- Pivot resistance is noted at 0.6696, 0.6719, 0.6746
| Levels | Levels.1 |
|---|---|
| Previous Daily High | 0.6691 |
| Previous Daily Low | 0.6641 |
| Previous Weekly High | 0.6793 |
| Previous Weekly Low | 0.6641 |
| Previous Monthly High | 0.6784 |
| Previous Monthly Low | 0.6564 |
| Daily Fibonacci 38.2% | 0.6672 |
| Daily Fibonacci 61.8% | 0.6660 |
| Daily Pivot Point S1 | 0.6646 |
| Daily Pivot Point S2 | 0.6618 |
| Daily Pivot Point S3 | 0.6596 |
| Daily Pivot Point R1 | 0.6696 |
| Daily Pivot Point R2 | 0.6719 |
| Daily Pivot Point R3 | 0.6746 |
[/s2If]
Join Our Telegram Group
")


