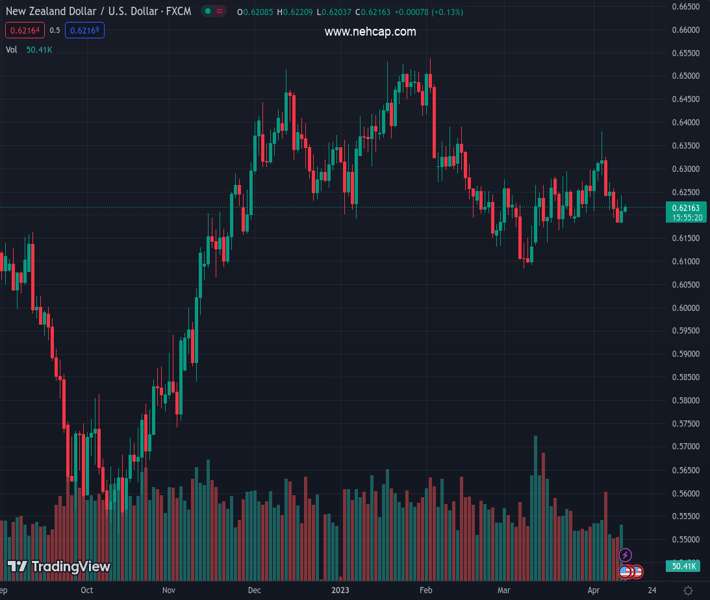
#NZDUSD @ 0.62440 prints mild losses after a volatile week. (Pivot Orderbook analysis)
…
This is a premium post.
[s2If !current_user_can(access_s2member_level4)]Please register for PREMIUM VERSION HERE to read full post below containing analysis. In case of any error or you think you are not able to read the full post below, please email us at support#nehcap.com [lwa][/s2If] [s2If current_user_can(access_s2member_level4)]
- NZD/USD prints mild losses after a volatile week.
- China’s heavy military drills near Taiwan Strait propel geopolitical fears despite Easter Monday holiday.
- RBNZ’s hawkish surprise fails to push back bears amid fresh boost to Fed rate hike concerns from the US NFP.
- US/China inflation numbers, FOMC minutes will be crucial to watch for clear directions.
The pair currently trades last at 0.62440.
The previous day high was 0.6389 while the previous day low was 0.6209. The daily 38.2% Fib levels comes at 0.632, expected to provide resistance. Similarly, the daily 61.8% fib level is at 0.6278, expected to provide resistance.
NZD/USD begins the trading week on a back foot as it drops to 0.6250 amid geopolitical fears emanating from China and Taiwan. Adding strength to the Kiwi pair’s downside move could be the recently firmer hawkish Fed bets. However, the Reserve Bank of New Zealand’s (RBNZ) 0.50% rate hike and cautious mood ahead of this week’s key data/events, as well as the Easter Monday holiday, put a floor under the prices.
Taiwan President Tsai Ing-wen’s US visit triggered the US-China woes as Beijing conducts strong military drills near Taiwan Strait. “China’s military simulated precision strikes against Taiwan in a second day of drills around the island on Sunday, with the island’s defense ministry reporting multiple air force sorties and that it was monitoring China’s missile forces,” reported Reuters.
On the other hand, Friday’s upbeat US employment data renewed hawkish Fed bets. However, the market participants also expect a rate cut in late 2023 and hence pour cold water on the face of the NZD/USD bears. That said, the CME’s FedWatch Tool suggests 69% odds of the 0.25% rate hike in May, versus 55% before the US jobs report.
On Friday, the US Bureau of Labor Statistics (BLS) revealed that Nonfarm Payrolls (NFP) rose by 236K in March, the lowest since January 2021 (considering the revisions), versus 240K expected and 326K prior. Further, the Unemployment Rate eased to 3.5% versus 3.6% prior while the Labor Force Participation Rate improved to 62.6% from 62.5%. Finally, annual wage inflation, per the Average Hourly Earnings, dropped to 4.2% from 4.6%, versus market forecasts of 4.3%.
It should be noted that the RBNZ’s hawkish surprise and the downbeat US Treasury bond yields, as well as fears of the US recession, weigh on the US Dollar and tease the Kiwi pair buyers ahead of the key catalysts.
Moving forward, the Easter Monday holiday in major markets could restrict NZD/USD moves despite the aforementioned price-negative catalysts. That said, Consumer Price Index (CPI) data from the US and China will join the latest Federal Open Market Committee (FOMC) Monetary Policy Meeting Minutes to direct short-term NZD/USD moves. It’s worth noting that any more escalation in the geopolitical fears won’t hesitate to portray the pair’s slump towards the 0.6200 round figure.
NZD/USD breaks a one-month-old ascending support line, now immediate resistance around 0.6265, but the 21-DMA support of 0.6245 tests the Kiwi pair sellers.
Technical Levels: Supports and Resistances
NZDUSD currently trading at 0.6252 at the time of writing. Pair opened at 0.6268 and is trading with a change of -0.26% % .
| Overview | Overview.1 | |
|---|---|---|
| 0 | Today last price | 0.6252 |
| 1 | Today Daily Change | -0.0016 |
| 2 | Today Daily Change % | -0.26% |
| 3 | Today daily open | 0.6268 |
The pair is trading above its 20 Daily moving average @ 0.6243, below its 50 Daily moving average @ 0.6259 , below its 100 Daily moving average @ 0.6302 and above its 200 Daily moving average @ 0.616
| Trends | Trends.1 | |
|---|---|---|
| 0 | Daily SMA20 | 0.6243 |
| 1 | Daily SMA50 | 0.6259 |
| 2 | Daily SMA100 | 0.6302 |
| 3 | Daily SMA200 | 0.6160 |
The previous day high was 0.6389 while the previous day low was 0.6209. The daily 38.2% Fib levels comes at 0.632, expected to provide resistance. Similarly, the daily 61.8% fib level is at 0.6278, expected to provide resistance.
Note the levels of interest below:
- Pivot support is noted at 0.6188, 0.6108, 0.6008
- Pivot resistance is noted at 0.6369, 0.6469, 0.6549
| Levels | Levels.1 |
|---|---|
| Previous Daily High | 0.6389 |
| Previous Daily Low | 0.6209 |
| Previous Weekly High | 0.6389 |
| Previous Weekly Low | 0.6207 |
| Previous Monthly High | 0.6298 |
| Previous Monthly Low | 0.6084 |
| Daily Fibonacci 38.2% | 0.6320 |
| Daily Fibonacci 61.8% | 0.6278 |
| Daily Pivot Point S1 | 0.6188 |
| Daily Pivot Point S2 | 0.6108 |
| Daily Pivot Point S3 | 0.6008 |
| Daily Pivot Point R1 | 0.6369 |
| Daily Pivot Point R2 | 0.6469 |
| Daily Pivot Point R3 | 0.6549 |
[/s2If]
Join Our Telegram Group
")


