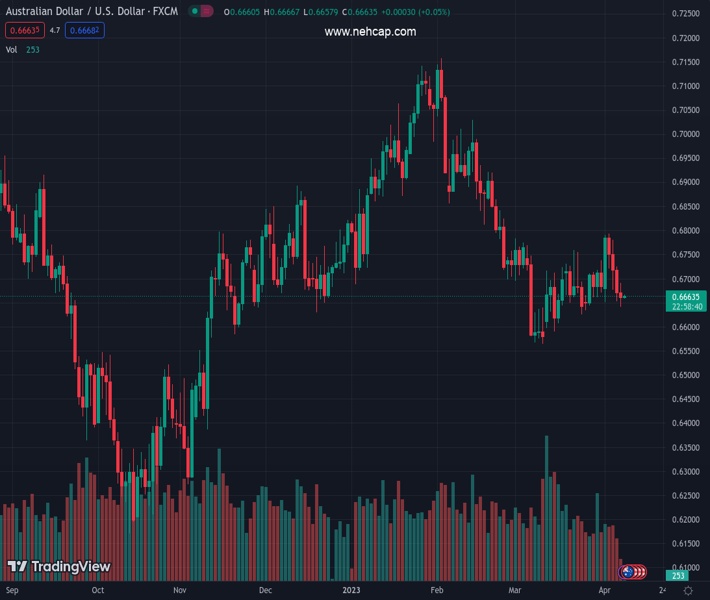
#AUDUSD @ 0.66680 is oscillating around 0.6660 as investors are still digesting the US Employment data. (Pivot Orderbook analysis)
…
This is a premium post.
[s2If !current_user_can(access_s2member_level4)]Please register for PREMIUM VERSION HERE to read full post below containing analysis. In case of any error or you think you are not able to read the full post below, please email us at support#nehcap.com [lwa][/s2If] [s2If current_user_can(access_s2member_level4)]
- AUD/USD is oscillating around 0.6660 as investors are still digesting the US Employment data.
- S&P500 settled the week with marginal gains as investors were anxious about US NFP data, which portrayed a quiet market mood.
- Chinese annual inflation
- is expected to soften to 0.1% vs. 1.0%, indicating bleak demand from households.
The pair currently trades last at 0.66680.
The previous day high was 0.6691 while the previous day low was 0.6641. The daily 38.2% Fib levels comes at 0.6672, expected to provide resistance. Similarly, the daily 61.8% fib level is at 0.666, expected to provide support.
The AUD/USD pair continuously trading sideways around 0.6660 in the Asian session. The Aussie asset is likely to continue the lackluster performance amid an extended weekend led by Easter Monday celebrations in Australia. While investors are expected to discount sluggish United States Employment data released on Friday.
S&P500 futures settled the week with marginal gains as investors were anxious about US Nonfarm Payrolls (NFP) data, portrayed a quiet market mood. The US Dollar Index (DXY) remained sideways around 102.00 after US NFP-inspired volatility as investors are required to scrutiny the entire US employment gamut for further action.
The US economy added 236K jobs in March, marginally lower than the expectations of 240K and critical lower than the prior release of 326K. The Unemployment Rate trimmed further to 3.5% from the consensus and the former release of 3.6%. Lower additions of fresh payrolls indicate that more rate from the Federal Reserve (Fed) are restricting firms to tap advances for expansion, which is impacting the demand for labor further.
Average Hourly Earnings were trimmed to 4.2% vs. the estimates of 4.3% and the former release of 4.6%. However, on a monthly basis, the labor cost index improved to 0.3% from the prior release of 0.2% but remained in line with expectations, which indicates that higher employment bills could continue to keep inflationary pressures at elevated levels.
Going forward, Chinese Consumer Price Index (CPI) data will be the key highlight. The annual inflation data is expected to soften dramatically to 0.1% from the former release of 1.0%, which indicates bleak demand from households. This might impact the economic outlook of China as the economy is struggling to show stellar recovery despite re-opening of the economy.
It is worth noting that Australia is the leading trading partner of China and lower households demand in China would impact the Australian Dollar.
Technical Levels: Supports and Resistances
AUDUSD currently trading at 0.6662 at the time of writing. Pair opened at 0.6674 and is trading with a change of -0.18 % .
| Overview | Overview.1 | |
|---|---|---|
| 0 | Today last price | 0.6662 |
| 1 | Today Daily Change | -0.0012 |
| 2 | Today Daily Change % | -0.1800 |
| 3 | Today daily open | 0.6674 |
The pair remains strongly bearish on the daily time frame. It trades below the 20 SMA @ 0.6688, 50 SMA 0.6784, 100 SMA @ 0.68 and 200 SMA @ 0.6748.
| Trends | Trends.1 | |
|---|---|---|
| 0 | Daily SMA20 | 0.6688 |
| 1 | Daily SMA50 | 0.6784 |
| 2 | Daily SMA100 | 0.6800 |
| 3 | Daily SMA200 | 0.6748 |
The previous day high was 0.6691 while the previous day low was 0.6641. The daily 38.2% Fib levels comes at 0.6672, expected to provide resistance. Similarly, the daily 61.8% fib level is at 0.666, expected to provide support.
Note the levels of interest below:
- Pivot support is noted at 0.6646, 0.6618, 0.6596
- Pivot resistance is noted at 0.6696, 0.6719, 0.6746
| Levels | Levels.1 |
|---|---|
| Previous Daily High | 0.6691 |
| Previous Daily Low | 0.6641 |
| Previous Weekly High | 0.6793 |
| Previous Weekly Low | 0.6641 |
| Previous Monthly High | 0.6784 |
| Previous Monthly Low | 0.6564 |
| Daily Fibonacci 38.2% | 0.6672 |
| Daily Fibonacci 61.8% | 0.6660 |
| Daily Pivot Point S1 | 0.6646 |
| Daily Pivot Point S2 | 0.6618 |
| Daily Pivot Point S3 | 0.6596 |
| Daily Pivot Point R1 | 0.6696 |
| Daily Pivot Point R2 | 0.6719 |
| Daily Pivot Point R3 | 0.6746 |
[/s2If]
Join Our Telegram Group
")


