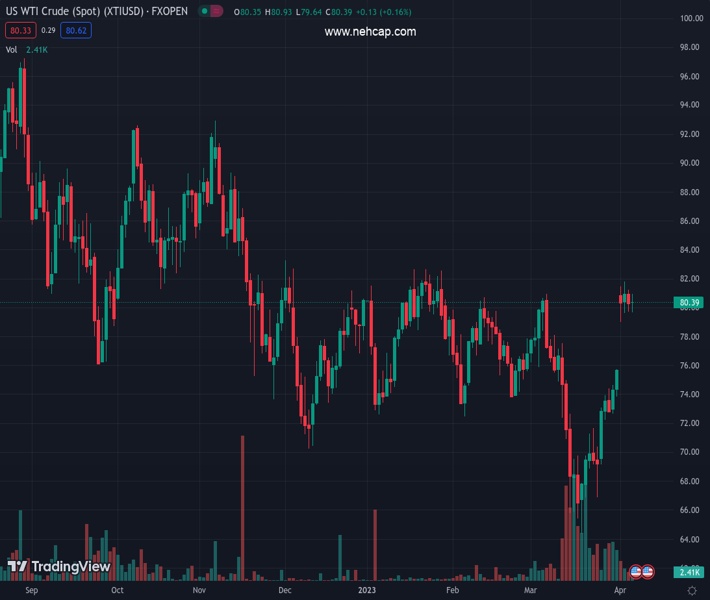
WTI crude oil prints three-week uptrend, seesaws around 10-week high of late. (Pivot Orderbook analysis)
…
This is a premium post.
[s2If !current_user_can(access_s2member_level4)]Please register for PREMIUM VERSION HERE to read full post below containing analysis. In case of any error or you think you are not able to read the full post below, please email us at support#nehcap.com [lwa][/s2If] [s2If current_user_can(access_s2member_level4)]
- WTI crude oil prints three-week uptrend, seesaws around 10-week high of late.
- OPEC+ surprise manages to keep Oil buyers on the table even if recession woes prod WTI of late.
- Downbeat US data weigh on US Dollar and allow the Oil price to remain firmer ahead of the key NFP.
- Odds of more Oil price upside can’t be ruled out amid downbeat forecasts for the US employment report for March.
The pair currently trades last at 80.48.
The previous day high was 80.97 while the previous day low was 79.68. The daily 38.2% Fib levels comes at 80.48, expected to provide resistance. Similarly, the daily 61.8% fib level is at 80.17, expected to provide support.
WTI crude oil remains inactive around $80.50, well-set for a three-week uptrend, as energy markets cheer the Good Friday holiday. In doing so, the black gold defends the week-start gains offered by the Organization of the Petroleum Exporting Countries (OPEC) and its allies led by Russia, known as OPEC+, which announced surprise output cut. However, fears of recession and a cautious mood ahead of the US employment report for March challenge the energy benchmark of late.
The OPEC+ group surprised markets with nearly 1.66 million barrels per day of a voluntary output cut. Following the OPEC+ announcements, the International Energy Agency (IEA) said that the OPEC+ decision to cut oil output risks exacerbating a strained market by pushing up oil prices amid inflationary pressures.
On the other hand, the US Dollar’s weakness, backed by downbeat US data, also underpinned the black gold’s recovery moves.
That said, the US Dollar Index (DXY) pares weekly losses around 102.00 while printing a four-day losing streak.
Talking about the US data, Initial Jobless Claims improved to 228K for the week ended on March 31 versus 200K expected and upwardly revised 246K prior. It’s worth noting that the Challenger Job Cuts for the said month rose to 89.703K from 77.77K prior. Previously, US JOLTS Job Openings dropped to the 19-month low in February while the ADP Employment Change for March also disappointed markets with 145K figures. Further, the US ISM Services PMI for March also amplified pessimism as it dropped to 51.2 versus 54.5 expected and 55.1 prior.
Also supporting the Oil price could be China’s optimism for economic growth and upbeat activity data from the dragon nation. Pan Gongsheng, head of China’s State Administration of Foreign Exchange (SAFE), said on Friday that Beijing “will fend off external financial market shocks and risks.”
It should be observed, however, that the recent calls of recession challenge the WTI crude oil buyers and hence more clues of economic slowdown should be watched for clear directions, especially when the commodity prices trade near the short-term key resistance line.
Apart from the recession news, the US jobs report for March will also be crucial to watch for clear directions. Analysts anticipate a softer print of the headline Nonfarm Payrolls (NFP), to 240K from 311K prior, as well as no change in the Unemployment Rate of 3.6%. However, the mixed expectations for the Average Hourly Earnings make the outcome even more interesting.
Unless providing a daily closing beyond a four-month-old descending resistance line, around $81.70 by the press time, WTI crude oil buyers should remain cautious.
Technical Levels: Supports and Resistances
XTIUSD currently trading at 80.48 at the time of writing. Pair opened at 80.48 and is trading with a change of 0.00% % .
| Overview | Overview.1 | |
|---|---|---|
| 0 | Today last price | 80.48 |
| 1 | Today Daily Change | 0.00 |
| 2 | Today Daily Change % | 0.00% |
| 3 | Today daily open | 80.48 |
The pair is trading above its 20 Daily moving average @ 73.22, above its 50 Daily moving average @ 75.74 , above its 100 Daily moving average @ 76.8 and below its 200 Daily moving average @ 83.09
| Trends | Trends.1 | |
|---|---|---|
| 0 | Daily SMA20 | 73.22 |
| 1 | Daily SMA50 | 75.74 |
| 2 | Daily SMA100 | 76.80 |
| 3 | Daily SMA200 | 83.09 |
The previous day high was 80.97 while the previous day low was 79.68. The daily 38.2% Fib levels comes at 80.48, expected to provide resistance. Similarly, the daily 61.8% fib level is at 80.17, expected to provide support.
Note the levels of interest below:
- Pivot support is noted at 79.79, 79.09, 78.5
- Pivot resistance is noted at 81.07, 81.66, 82.36
| Levels | Levels.1 |
|---|---|
| Previous Daily High | 80.97 |
| Previous Daily Low | 79.68 |
| Previous Weekly High | 75.78 |
| Previous Weekly Low | 69.18 |
| Previous Monthly High | 80.99 |
| Previous Monthly Low | 64.39 |
| Daily Fibonacci 38.2% | 80.48 |
| Daily Fibonacci 61.8% | 80.17 |
| Daily Pivot Point S1 | 79.79 |
| Daily Pivot Point S2 | 79.09 |
| Daily Pivot Point S3 | 78.50 |
| Daily Pivot Point R1 | 81.07 |
| Daily Pivot Point R2 | 81.66 |
| Daily Pivot Point R3 | 82.36 |
[/s2If]
Join Our Telegram Group
")


