#USDMXN @ 18.2363 remains sidelined after snapping three-day uptrend the previous day., @nehcap view: Recovery expected (Pivot Orderbook analysis)
…
This is a premium post.
[s2If !current_user_can(access_s2member_level4)]Please register for PREMIUM VERSION HERE to read full post below containing analysis. In case of any error or you think you are not able to read the full post below, please email us at support#nehcap.com [lwa][/s2If] [s2If current_user_can(access_s2member_level4)]
- USD/MXN remains sidelined after snapping three-day uptrend the previous day.
- Convergence of 200-HMA, three-week-old previous resistance line puts a floor under Mexican Peso pair’s price.
- Hesitance in extending trend line break, looming bull cross on MACD lures buyers; recovery remains elusive below 18.40.
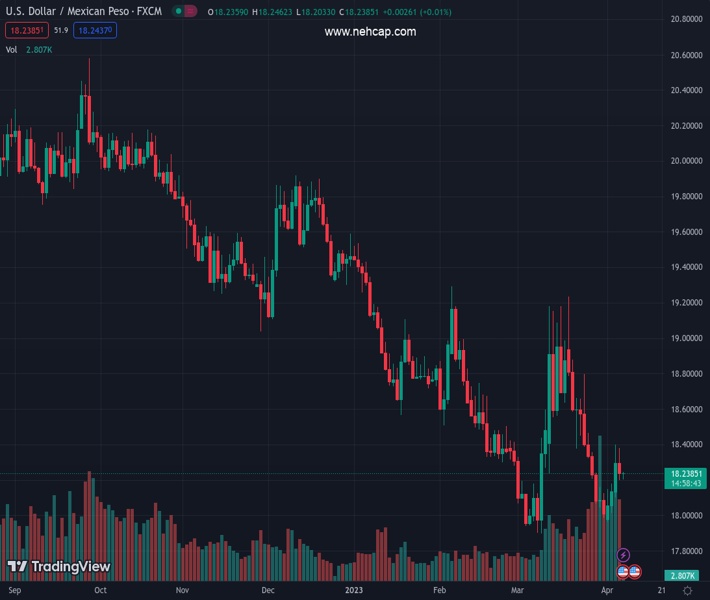
The pair currently trades last at 18.2363.
The previous day high was 18.381 while the previous day low was 18.2004. The daily 38.2% Fib levels comes at 18.2694, expected to provide resistance. Similarly, the daily 61.8% fib level is at 18.312, expected to provide resistance.
USD/MXN pair treads water around 18.23 during a sluggish start of the Good Friday holidays in major bourses. In doing so, the Mexican Peso (MXN) pair struggles to extend the previous day’s downside break of an upward-sloping trend line stretched from Tuesday.
Not only the USD/MXN pair’s resistance in extending the trend line break but an impending bull cross on the MACD indicator also challenge the sellers.
Furthermore, the 200-HMA and resistance-turned-support line from mid-March, around 18.15 by the press time, acts as a tough nut to crack for the USD/MXN bears.
In a case where the pair drops below 18.15, the odds of witnessing a fresh Year-To-Date (YTD) low, currently around 17.96, can’t be ruled out.
Meanwhile, USD/MXN recovery should initially cross the three-day-old previous support line, around 18.35 at the latest, to restore intraday buyer’s confidence.
Even so, the weekly top surrounding 18.40 can act as an extra filter towards the north before giving control to the bulls.
Following that, multiple levels near the 38.2% Fibonacci retracement of the pair’s fall from March 20 to April 03, around 18.45, can entertain the USD/MXN bulls before directing them to 18.80 and then to the 19.00 psychological magnet.
Overall, USD/MXN is yet to break the 18.15 support to convince bears. Until then, the hopes of witnessing a recovery remain on the table.
Trend: Recovery expected
Technical Levels: Supports and Resistances
USDMXN currently trading at 18.2401 at the time of writing. Pair opened at 18.2422 and is trading with a change of -0.01% % .
| Overview | Overview.1 | |
|---|---|---|
| 0 | Today last price | 18.2401 |
| 1 | Today Daily Change | -0.0021 |
| 2 | Today Daily Change % | -0.01% |
| 3 | Today daily open | 18.2422 |
The pair remains strongly bearish on the daily time frame. It trades below the 20 SMA @ 18.4595, 50 SMA 18.4816, 100 SMA @ 18.9036 and 200 SMA @ 19.4941.
| Trends | Trends.1 | |
|---|---|---|
| 0 | Daily SMA20 | 18.4595 |
| 1 | Daily SMA50 | 18.4816 |
| 2 | Daily SMA100 | 18.9036 |
| 3 | Daily SMA200 | 19.4941 |
The previous day high was 18.381 while the previous day low was 18.2004. The daily 38.2% Fib levels comes at 18.2694, expected to provide resistance. Similarly, the daily 61.8% fib level is at 18.312, expected to provide resistance.
Note the levels of interest below:
- Pivot support is noted at 18.168, 18.0939, 17.9874
- Pivot resistance is noted at 18.3487, 18.4552, 18.5293
| Levels | Levels.1 |
|---|---|
| Previous Daily High | 18.3810 |
| Previous Daily Low | 18.2004 |
| Previous Weekly High | 18.4681 |
| Previous Weekly Low | 17.9900 |
| Previous Monthly High | 19.2324 |
| Previous Monthly Low | 17.8977 |
| Daily Fibonacci 38.2% | 18.2694 |
| Daily Fibonacci 61.8% | 18.3120 |
| Daily Pivot Point S1 | 18.1680 |
| Daily Pivot Point S2 | 18.0939 |
| Daily Pivot Point S3 | 17.9874 |
| Daily Pivot Point R1 | 18.3487 |
| Daily Pivot Point R2 | 18.4552 |
| Daily Pivot Point R3 | 18.5293 |
[/s2If]
Join Our Telegram Group
")


