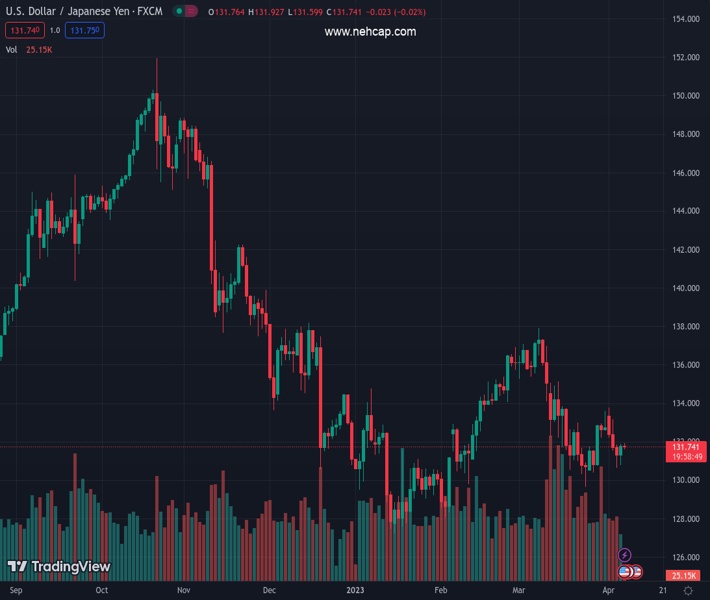
#USDJPY @ 131.767 takes offers to refresh intraday low, reverses the previous day’s corrective bounce. (Pivot Orderbook analysis)
…
This is a premium post.
[s2If !current_user_can(access_s2member_level4)]Please register for PREMIUM VERSION HERE to read full post below containing analysis. In case of any error or you think you are not able to read the full post below, please email us at support#nehcap.com [lwa][/s2If] [s2If current_user_can(access_s2member_level4)]
- USD/JPY takes offers to refresh intraday low, reverses the previous day’s corrective bounce.
- Japan’s Inflation-adjusted real wages drops for 11th month in February but at a slower pace.
- Benchmark Treasury bond yields consolidates weekly losses amid Good Friday holiday in major markets.
- Recession woes, downbeat US data favor Yen bears ahead of top-tier US employment statistics.
The pair currently trades last at 131.767.
The previous day high was 131.91 while the previous day low was 130.78. The daily 38.2% Fib levels comes at 131.48, expected to provide support. Similarly, the daily 61.8% fib level is at 131.21, expected to provide support.
USD/JPY renews its intraday low near 131.60 as it justifies the upbeat Japan data amid sluggish markets due to the Good Friday holiday at major bourses. That said, the Yen pair remains on the way to posting weekly losses with the latest fall, especially amid increasing hawkish bias for the Bank of Japan (BoJ).
The hawkish bias for the BoJ intensifies amid upbeat Japanese data, as well as comments from the Japanese Finance Minister (FinMin) Sunichi Suzuki.
“Inflation-adjusted real wages, a gauge of households’ purchasing power, dropped by 2.6% in February from a year earlier, following a 4.1% fall in January that marked the fastest decline in nearly nine years,” per Reuters. It’s worth observing that Japan’s Overall Household Spending and Labor Cash Earnings also improved in February and favor the odds of the BoJ’s exit from the ultra-easy monetary policy.
It should be noted that Japan’s FinMin Suzuki showed hopes of witnessing suitable policy and hence raise fears of hawkish stunts from the BoJ officials, especially amid Haruhiko Kuroda’s departure.
Elsewhere, US Treasury bond yields pare weekly losses amid mixed concerns about the US recession and downbeat US data. With this, the US 10-year and two-year Treasury bond yields also stay pressured, despite the latest consolidation around 3.30% and 3.83% in that order.
Further, “Research from the Fed has argued that the ‘near-term forward spread’ comparing the forward rate on Treasury bills 18 months from now with the current yield on a three-month Treasury bill was the most reliable bond market signal of an imminent economic contraction,” said Reuters.
Above all, the divergence between the upbeat Japan data and disappointing US statistics keeps the USD/JPY pair on the bear’s table. However, the Yen pair’s further downside hinges on how well the US employment numbers can push back the recession woes. Forecasts suggest the headline Nonfarm Payrolls (NFP) be 240K, down from 311K prior, as well as estimating no change in the Unemployment Rate of 3.6%.
Although the 50-DMA restricts immediate USD/JPY upside to around 133.15, USD/JPY bears need validation from an upward-sloping support line from mid-January, close to 131.30 by the press time.
Technical Levels: Supports and Resistances
USDJPY currently trading at 131.68 at the time of writing. Pair opened at 131.79 and is trading with a change of -0.08% % .
| Overview | Overview.1 | |
|---|---|---|
| 0 | Today last price | 131.68 |
| 1 | Today Daily Change | -0.11 |
| 2 | Today Daily Change % | -0.08% |
| 3 | Today daily open | 131.79 |
The pair remains strongly bearish on the daily time frame. It trades below the 20 SMA @ 132.31, 50 SMA 133.08, 100 SMA @ 133.56 and 200 SMA @ 137.24.
| Trends | Trends.1 | |
|---|---|---|
| 0 | Daily SMA20 | 132.31 |
| 1 | Daily SMA50 | 133.08 |
| 2 | Daily SMA100 | 133.56 |
| 3 | Daily SMA200 | 137.24 |
The previous day high was 131.91 while the previous day low was 130.78. The daily 38.2% Fib levels comes at 131.48, expected to provide support. Similarly, the daily 61.8% fib level is at 131.21, expected to provide support.
Note the levels of interest below:
- Pivot support is noted at 131.08, 130.36, 129.95
- Pivot resistance is noted at 132.2, 132.62, 133.33
| Levels | Levels.1 |
|---|---|
| Previous Daily High | 131.91 |
| Previous Daily Low | 130.78 |
| Previous Weekly High | 133.60 |
| Previous Weekly Low | 130.41 |
| Previous Monthly High | 137.91 |
| Previous Monthly Low | 129.64 |
| Daily Fibonacci 38.2% | 131.48 |
| Daily Fibonacci 61.8% | 131.21 |
| Daily Pivot Point S1 | 131.08 |
| Daily Pivot Point S2 | 130.36 |
| Daily Pivot Point S3 | 129.95 |
| Daily Pivot Point R1 | 132.20 |
| Daily Pivot Point R2 | 132.62 |
| Daily Pivot Point R3 | 133.33 |
[/s2If]
Join Our Telegram Group
")


