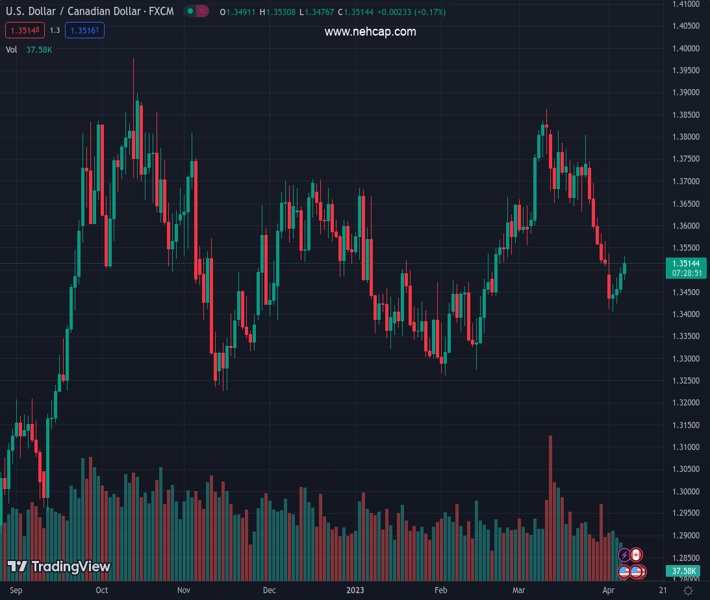
#USDCAD @ 1.35069 jumped in response to the US jobs data. (Pivot Orderbook analysis)
…
This is a premium post.
[s2If !current_user_can(access_s2member_level4)]Please register for PREMIUM VERSION HERE to read full post below containing analysis. In case of any error or you think you are not able to read the full post below, please email us at support#nehcap.com [lwa][/s2If] [s2If current_user_can(access_s2member_level4)]
- USD/CAD jumped in response to the US jobs data.
- Despite the lower-than-expected job growth in March, the US Dollar gained ground.
- Average Hourly Earnings edged lower, while the jobless rate remained unchanged.
The pair currently trades last at 1.35069.
The previous day high was 1.3506 while the previous day low was 1.3447. The daily 38.2% Fib levels comes at 1.3483, expected to provide support. Similarly, the daily 61.8% fib level is at 1.3469, expected to provide support.
The USD/CAD touched four-day news highs after the US Nonfarm Payrolls, though it retreated somewhat, as the US jobs data showed that the labor market continued to slow down. At the time of writing, the USD/CAD trades volatile within the 1.3497-1.3510 range, holding to its earlier gains.
On Friday, the US Bureau of Labor Statistics (BLS) showed that US job growth in March slowed to 236K, lower than the expected 240K and the 311K jobs added in February. The Average Hourly Earnings increased by 4.2% YoY, falling short of the forecasted 4.3%, and the Unemployment Rate was 3.4% YoY, 0.2% lower than the anticipated 3.6%.
In the fixed-income market, US Treasury bond yields extended their gains, with the 2-year US T-bond yield, the most sensitive to interest rates, rising 12 basis points. The CME FedWatch Tool made a U-turn, with odds for a 25 bps rate hike by the US Federal Reserve itching up, to 59.8%, compared to Thursday’s 49.2%.
On the headline, the USD/CAD bounced from around 1.3500 and hit a daily high of 1.3530, breaking the R1 daily pivot at 1.3518 on its way north. Of late, the USD/CAD pair reversed its course, stabilizing around the current exchange rates but holding the spot price at around 1.3500. For a bullish resumption, the USD/CAD needs to reclaim 1.3518, so it can re-test the day’s high before testing the R2 pivot at 1.3540. Conversely, a fall below 1.3500 will exacerbate a dip toward the daily pivot at 1.3481.
Technical Levels: Supports and Resistances
USDCAD currently trading at 1.3506 at the time of writing. Pair opened at 1.3492 and is trading with a change of 0.1 % .
| Overview | Overview.1 | |
|---|---|---|
| 0 | Today last price | 1.3506 |
| 1 | Today Daily Change | 0.0014 |
| 2 | Today Daily Change % | 0.1000 |
| 3 | Today daily open | 1.3492 |
The pair is trading below its 20 Daily moving average @ 1.3636, below its 50 Daily moving average @ 1.3551 , below its 100 Daily moving average @ 1.3527 and above its 200 Daily moving average @ 1.3387
| Trends | Trends.1 | |
|---|---|---|
| 0 | Daily SMA20 | 1.3636 |
| 1 | Daily SMA50 | 1.3551 |
| 2 | Daily SMA100 | 1.3527 |
| 3 | Daily SMA200 | 1.3387 |
The previous day high was 1.3506 while the previous day low was 1.3447. The daily 38.2% Fib levels comes at 1.3483, expected to provide support. Similarly, the daily 61.8% fib level is at 1.3469, expected to provide support.
Note the levels of interest below:
- Pivot support is noted at 1.3457, 1.3423, 1.3398
- Pivot resistance is noted at 1.3516, 1.3541, 1.3575
| Levels | Levels.1 |
|---|---|
| Previous Daily High | 1.3506 |
| Previous Daily Low | 1.3447 |
| Previous Weekly High | 1.3745 |
| Previous Weekly Low | 1.3508 |
| Previous Monthly High | 1.3862 |
| Previous Monthly Low | 1.3508 |
| Daily Fibonacci 38.2% | 1.3483 |
| Daily Fibonacci 61.8% | 1.3469 |
| Daily Pivot Point S1 | 1.3457 |
| Daily Pivot Point S2 | 1.3423 |
| Daily Pivot Point S3 | 1.3398 |
| Daily Pivot Point R1 | 1.3516 |
| Daily Pivot Point R2 | 1.3541 |
| Daily Pivot Point R3 | 1.3575 |
[/s2If]
Join Our Telegram Group
")


