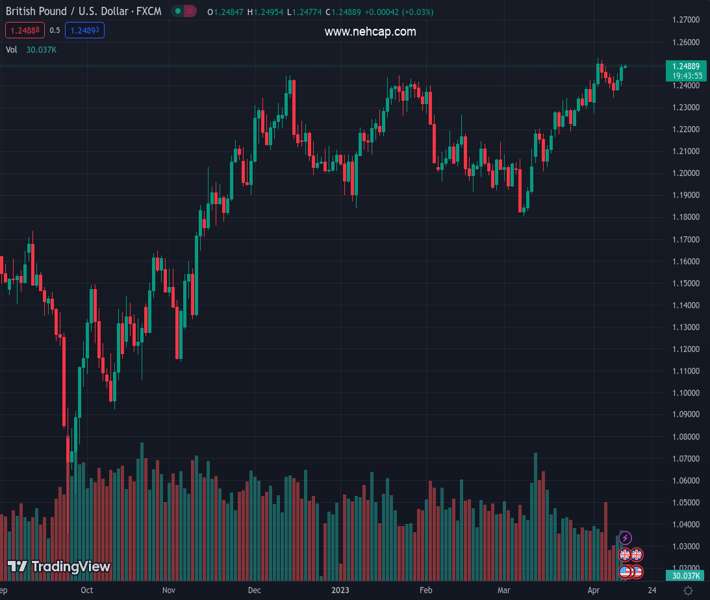
#GBPUSD @ 1.24413 snaps two-day losing streak with minor gains. (Pivot Orderbook analysis)
…
This is a premium post.
[s2If !current_user_can(access_s2member_level4)]Please register for PREMIUM VERSION HERE to read full post below containing analysis. In case of any error or you think you are not able to read the full post below, please email us at support#nehcap.com [lwa][/s2If] [s2If current_user_can(access_s2member_level4)]
- GBP/USD snaps two-day losing streak with minor gains.
- Comparatively more hawkish hopes from BoE than Fed contrast with Brexit doubts to prod Cable buyers.
- US employment numbers are likely to allow GBP/USD to remain firmer for the fourth consecutive week.
The pair currently trades last at 1.24413.
The previous day high was 1.2487 while the previous day low was 1.2413. The daily 38.2% Fib levels comes at 1.2441, expected to provide support. Similarly, the daily 61.8% fib level is at 1.2459, expected to provide resistance.
GBP/USD seesaws around 1.2155-60 while printing the first daily gains in three amid early Good Friday morning in London. In doing so, the Cable pair cheers hawkish hopes from the Bank of England (BoE) while also portraying the cautious mood ahead of the key US Nonfarm Payrolls (NFP).
Andrew Goodwin, Chief UK Economist at Oxford Economics suggests another 0.25% rate hike from the “Old Lady”, as the BoE is informally known, amid persistent inflation pressure.
That said, the UK’s house price index signaled intact price pressure even if the BoE’s Monthly Decision Maker Panel (DMP) survey hints at likely easing the Consumer Price Index (CPI), from 5.9% expected in February to 5.8% for one-year ahead measure.
On the other hand, fears that the new Brexit deal will deter the European Union (EU) imports, per BBC News, seem to challenge the GBP/USD prices. The news quotes a Cold Chain Federation while stating that new plans for post-Brexit border checks on goods coming into the UK will deter many EU suppliers and push up food prices.
Elsewhere, downbeat US data raise fears of no rate hikes from the Federal Reserve (Fed) in May and weigh on the US Dollar. However, the same US statistics trigger recession woes and put a floor under the greenback. With this, the US Dollar Index (DXY) clings to mild gains around 102.00.
Talking about the US data, Initial Jobless Claims improved to 228K for the week ended on March 31 versus 200K expected and upwardly revised 246K prior. It’s worth noting that the Challenger Job Cuts for the said month rose to 89.703K from 77.77K prior. Previously, US JOLTS Job Openings dropped to the 19-month low in February while the ADP Employment Change for March also disappointed markets with 145K figures. Further, the US ISM Services PMI for March also amplified pessimism as it dropped to 51.2 versus 54.5 expected and 55.1 prior.
Amid these plays, market sentiment remains sour and the yields seem to pause recent downside, which in turn challenges the GBP/USD buyers. However, it all depends upon the US employment report for fresh calls.
Also read: Nonfarm Payrolls Preview: Markets fear depressing data, three scenarios for the US Dollar
A one-month-old ascending trend channel, currently between 1.2375 and 1.2550, defends GBP/USD bulls.
Technical Levels: Supports and Resistances
GBPUSD currently trading at 1.2456 at the time of writing. Pair opened at 1.244 and is trading with a change of 0.13% % .
| Overview | Overview.1 | |
|---|---|---|
| 0 | Today last price | 1.2456 |
| 1 | Today Daily Change | 0.0016 |
| 2 | Today Daily Change % | 0.13% |
| 3 | Today daily open | 1.244 |
The pair remains strongly bullish on the daily timeframe. It trades above its 20 SMA @ 1.2274, 50 SMA 1.2155, 100 SMA @ 1.2154 and 200 SMA @ 1.1901.
| Trends | Trends.1 | |
|---|---|---|
| 0 | Daily SMA20 | 1.2274 |
| 1 | Daily SMA50 | 1.2155 |
| 2 | Daily SMA100 | 1.2154 |
| 3 | Daily SMA200 | 1.1901 |
The previous day high was 1.2487 while the previous day low was 1.2413. The daily 38.2% Fib levels comes at 1.2441, expected to provide support. Similarly, the daily 61.8% fib level is at 1.2459, expected to provide resistance.
Note the levels of interest below:
- Pivot support is noted at 1.2406, 1.2372, 1.2332
- Pivot resistance is noted at 1.248, 1.2521, 1.2554
| Levels | Levels.1 |
|---|---|
| Previous Daily High | 1.2487 |
| Previous Daily Low | 1.2413 |
| Previous Weekly High | 1.2424 |
| Previous Weekly Low | 1.2219 |
| Previous Monthly High | 1.2424 |
| Previous Monthly Low | 1.1803 |
| Daily Fibonacci 38.2% | 1.2441 |
| Daily Fibonacci 61.8% | 1.2459 |
| Daily Pivot Point S1 | 1.2406 |
| Daily Pivot Point S2 | 1.2372 |
| Daily Pivot Point S3 | 1.2332 |
| Daily Pivot Point R1 | 1.2480 |
| Daily Pivot Point R2 | 1.2521 |
| Daily Pivot Point R3 | 1.2554 |
[/s2If]
Join Our Telegram Group
")


