#GBPUSD @ 1.24126 tumbled on an initial reaction to the headline. (Pivot Orderbook analysis)
…
This is a premium post.
[s2If !current_user_can(access_s2member_level4)]Please register for PREMIUM VERSION HERE to read full post below containing analysis. In case of any error or you think you are not able to read the full post below, please email us at support#nehcap.com [lwa][/s2If] [s2If current_user_can(access_s2member_level4)]
- GBP/USD tumbled on an initial reaction to the headline.
- US Nonfarm Payrolls for March came below estimates, but the US Dollar rallied.
- Average Hourly Earnings came a tick lower, while the Unemployment Rate was unchanged.
The pair currently trades last at 1.24126.
The previous day high was 1.2487 while the previous day low was 1.2413. The daily 38.2% Fib levels comes at 1.2441, expected to provide resistance. Similarly, the daily 61.8% fib level is at 1.2459, expected to provide resistance.
GBP/USD tumbles on a worse-than-expected US Nonfarm Payrolls report, with the US economy adding fewer jobs than analysts’ consensus. However, the initial reaction favored the US Dollar (USD). At the time of writing, the GBP/USD trades volatile around the 1.2450-1.2370 range, below its opening price.
Delving into March’s Nonfarm Payrolls data, the US Bureau of Labor Statistics (BLS) revealed the creation of fewer than 240K employments estimated, increased by 236, and trailed February’s 311K. Average Hourly Earnings, estimated at 4.3%, came at 4.2%, and the Unemployment Rate was at 3.5%YoY, below the expected 3.6%.
The GBP/USD printed a new four-day low, at 1.2389, in a perception that the report was soft, but not as probably estimated to be a scenario that could weaken the USD. The GBP/USD tumbled below the S1 daily pivot, at 1.2405, with traders eyeing the S2 daily pivot at 1.2370.
Technical Levels: Supports and Resistances
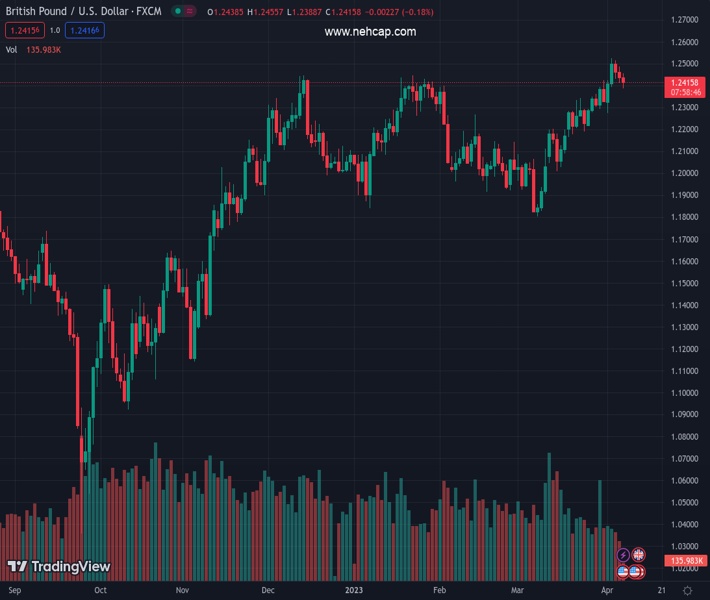
GBPUSD currently trading at 1.2429 at the time of writing. Pair opened at 1.244 and is trading with a change of -0.09 % .
| Overview | Overview.1 | |
|---|---|---|
| 0 | Today last price | 1.2429 |
| 1 | Today Daily Change | -0.0011 |
| 2 | Today Daily Change % | -0.0900 |
| 3 | Today daily open | 1.2440 |
The pair remains strongly bullish on the daily timeframe. It trades above its 20 SMA @ 1.2274, 50 SMA 1.2155, 100 SMA @ 1.2154 and 200 SMA @ 1.1901.
| Trends | Trends.1 | |
|---|---|---|
| 0 | Daily SMA20 | 1.2274 |
| 1 | Daily SMA50 | 1.2155 |
| 2 | Daily SMA100 | 1.2154 |
| 3 | Daily SMA200 | 1.1901 |
The previous day high was 1.2487 while the previous day low was 1.2413. The daily 38.2% Fib levels comes at 1.2441, expected to provide resistance. Similarly, the daily 61.8% fib level is at 1.2459, expected to provide resistance.
Note the levels of interest below:
- Pivot support is noted at 1.2406, 1.2372, 1.2332
- Pivot resistance is noted at 1.248, 1.2521, 1.2554
| Levels | Levels.1 |
|---|---|
| Previous Daily High | 1.2487 |
| Previous Daily Low | 1.2413 |
| Previous Weekly High | 1.2424 |
| Previous Weekly Low | 1.2219 |
| Previous Monthly High | 1.2424 |
| Previous Monthly Low | 1.1803 |
| Daily Fibonacci 38.2% | 1.2441 |
| Daily Fibonacci 61.8% | 1.2459 |
| Daily Pivot Point S1 | 1.2406 |
| Daily Pivot Point S2 | 1.2372 |
| Daily Pivot Point S3 | 1.2332 |
| Daily Pivot Point R1 | 1.2480 |
| Daily Pivot Point R2 | 1.2521 |
| Daily Pivot Point R3 | 1.2554 |
[/s2If]
Join Our Telegram Group
")


