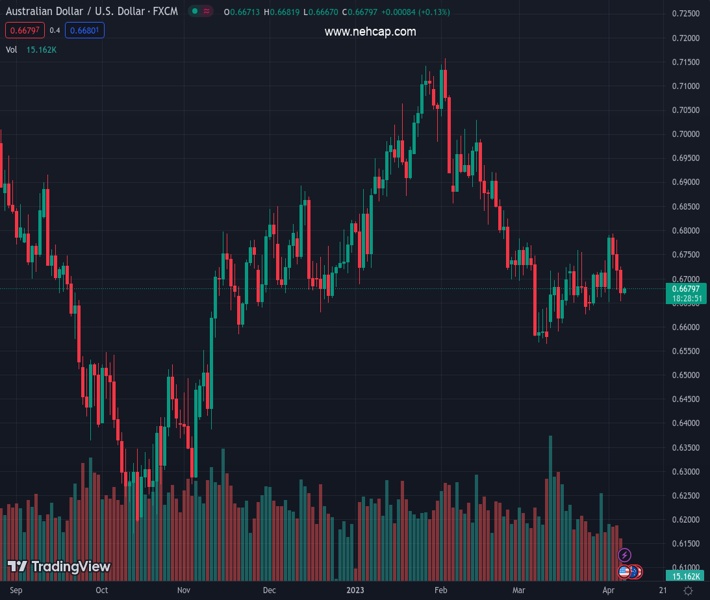
#AUDUSD @ 0.66804 picks up bids to refresh intraday high, snaps three-day losing streak., @nehcap view: Further upside expected (Pivot Orderbook analysis)
…
This is a premium post.
[s2If !current_user_can(access_s2member_level4)]Please register for PREMIUM VERSION HERE to read full post below containing analysis. In case of any error or you think you are not able to read the full post below, please email us at support#nehcap.com [lwa][/s2If] [s2If current_user_can(access_s2member_level4)]
- AUD/USD picks up bids to refresh intraday high, snaps three-day losing streak.
- Clear break of one-month-old ascending trend channel, bearish moving average crossover keeps sellers hopeful.
- US NFP may bolster recession woes and weigh on prices on matching downbeat forecasts.
The pair currently trades last at 0.66804.
The previous day high was 0.6725 while the previous day low was 0.6653. The daily 38.2% Fib levels comes at 0.6681, expected to provide resistance. Similarly, the daily 61.8% fib level is at 0.6698, expected to provide resistance.
AUD/USD pares weekly losses around 0.6680 as traders prepare for the US Nonfarm Payrolls (NFP) during Good Friday’s holiday-driven sluggish session. In doing so, the Aussie pair prints the first daily gains in four amid upbeat headlines from Australia’s major customer China.
Also read: China’s SAFE: Will fend off external financial market shocks and risks
However, the Reserve Bank of Australia’s (RBA) dovish play joins the recession woes and exerts downside pressure on the AUD/USD prices.
Also read: AUD/USD justifies risk-barometer status around 0.6670 as recession woes loom, US NFP eyed
Technically, the Aussie pair’s rejection of a one-month-old bullish channel and a bearish moving average crossover, signaled by the 50-DMA’s piercing of the 100-DMA from above, keep the AUD/USD sellers hopeful. Adding strength to the downside bias is the steady RSI (14) line.
That said, the quote’s latest rebound remains elusive unless it stays below the aforementioned channel’s lower line, close to 0.6690 by the press time.
Apart from the 0.6690 immediate hurdle, the 0.6700 round figure can also test the pair buyers before giving them control.
Even so, the 50-DMA, the 100-DMA and the top line of the stated channel, around 0.6785, 0.6800 and 0.6820 in that order, can challenge the AUD/USD buyers afterward.
Alternatively, an upward-sloping support line from the last November, close to 0.6620 by the press time, puts a floor under the AUD/USD prices.
Following that, the previous monthly low of 0.6564, also the Year-To-Date (YTD) bottom, will gain the market’s attention.
Trend: Further upside expected
Technical Levels: Supports and Resistances
AUDUSD currently trading at 0.668 at the time of writing. Pair opened at 0.6672 and is trading with a change of 0.12% % .
| Overview | Overview.1 | |
|---|---|---|
| 0 | Today last price | 0.668 |
| 1 | Today Daily Change | 0.0008 |
| 2 | Today Daily Change % | 0.12% |
| 3 | Today daily open | 0.6672 |
The pair remains strongly bearish on the daily time frame. It trades below the 20 SMA @ 0.6684, 50 SMA 0.6792, 100 SMA @ 0.68 and 200 SMA @ 0.6748.
| Trends | Trends.1 | |
|---|---|---|
| 0 | Daily SMA20 | 0.6684 |
| 1 | Daily SMA50 | 0.6792 |
| 2 | Daily SMA100 | 0.6800 |
| 3 | Daily SMA200 | 0.6748 |
The previous day high was 0.6725 while the previous day low was 0.6653. The daily 38.2% Fib levels comes at 0.6681, expected to provide resistance. Similarly, the daily 61.8% fib level is at 0.6698, expected to provide resistance.
Note the levels of interest below:
- Pivot support is noted at 0.6642, 0.6611, 0.6569
- Pivot resistance is noted at 0.6714, 0.6756, 0.6786
| Levels | Levels.1 |
|---|---|
| Previous Daily High | 0.6725 |
| Previous Daily Low | 0.6653 |
| Previous Weekly High | 0.6738 |
| Previous Weekly Low | 0.6634 |
| Previous Monthly High | 0.6784 |
| Previous Monthly Low | 0.6564 |
| Daily Fibonacci 38.2% | 0.6681 |
| Daily Fibonacci 61.8% | 0.6698 |
| Daily Pivot Point S1 | 0.6642 |
| Daily Pivot Point S2 | 0.6611 |
| Daily Pivot Point S3 | 0.6569 |
| Daily Pivot Point R1 | 0.6714 |
| Daily Pivot Point R2 | 0.6756 |
| Daily Pivot Point R3 | 0.6786 |
[/s2If]
Join Our Telegram Group
")


