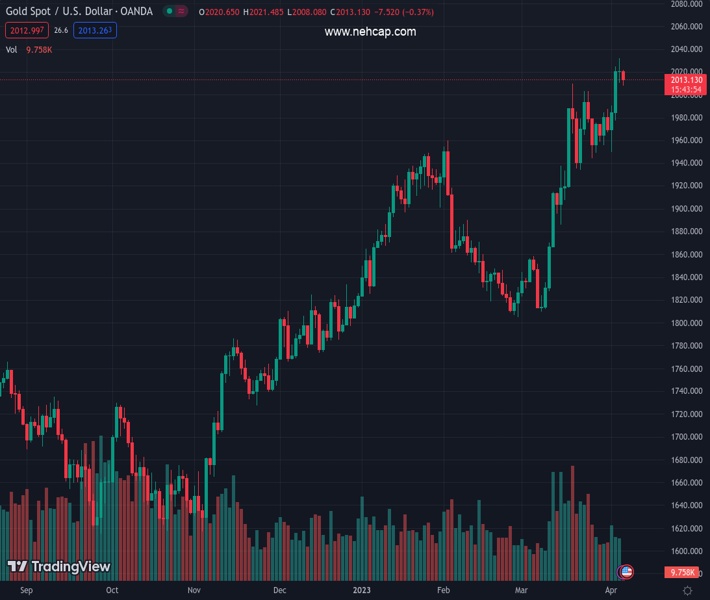
#XAUUSD @ 2,013.19 Gold price is likely to continue its downside move till $2,000.00 as US Dollar’s safe-haven appeal has improved. (Pivot Orderbook analysis)
…
This is a premium post.
[s2If !current_user_can(access_s2member_level4)]Please register for PREMIUM VERSION HERE to read full post below containing analysis. In case of any error or you think you are not able to read the full post below, please email us at support#nehcap.com [lwa][/s2If] [s2If current_user_can(access_s2member_level4)]
- Gold price is likely to continue its downside move till $2,000.00 as US Dollar’s safe-haven appeal has improved.
- Slowing economic activities due to higher interest rates by the Fed are responsible for a recession in the US economy.
- Fed Mester advocates rates above 5% this year and holding them at restrictive levels for some time to quell inflation.
The pair currently trades last at 2013.19.
The previous day high was 2032.11 while the previous day low was 2010.08. The daily 38.2% Fib levels comes at 2023.69, expected to provide resistance. Similarly, the daily 61.8% fib level is at 2018.5, expected to provide resistance.
Gold price (XAU/USD) has dropped firmly to near $2,010.00 in the early European session. The precious metal is likely to attract more offers and may find a cushion near the psychological support of $2,000.00 ahead. The downside bias for the Gold price has stemmed from geopolitical tensions between the United States and China.
China seems uneasy about arms support to Taiwan from the United States. In retaliation, a Chinese Foreign Ministry spokesperson said China will take resolute and effective measures to safeguard national sovereignty, and territorial integrity. This has spooked the market sentiment and risk-sensitive assets have taken the bullet.
The US Dollar Index (DXY) is making efforts in keeping its business above 102.00. Meanwhile, the 10-year US Treasury yields have slipped below 3.3% again on expectations that the labor market is not extremely tight anymore.
Apart from the softening of the US labor market, the anticipation of a recession has strengthened further. Slowing economic activities due to higher interest rates by the Federal Reserve (Fed) are responsible for a recession in the US economy.
The street is expecting a neutral stance from Fed chair Jerome Powell for May’s monetary policy, however, Cleveland Fed Bank President Loretta Mester said policymakers should move their benchmark rate above 5% this year and hold it at restrictive levels for some time to quell inflation, as reported by Bloomberg.
Gold price has challenged the immediate support plotted from Wednesday’s low at $2,010.88 on an hourly scale. The precious metal has slipped sharply below the 20-period Exponential Moving Average (EMA) at $2,017.18 while the 50-period EMA at $2,011.36 is providing cushion to the Gold bulls.
The Relative Strength Index (RSI) (14) has found support near 40.00. A case of a breakdown below the same would activate the bullish momentum.
Technical Levels: Supports and Resistances
XAUUSD currently trading at 2013.62 at the time of writing. Pair opened at 2020.83 and is trading with a change of -0.36 % .
| Overview | Overview.1 | |
|---|---|---|
| 0 | Today last price | 2013.62 |
| 1 | Today Daily Change | -7.21 |
| 2 | Today Daily Change % | -0.36 |
| 3 | Today daily open | 2020.83 |
The pair remains strongly bullish on the daily timeframe. It trades above its 20 SMA @ 1953.84, 50 SMA 1897.26, 100 SMA @ 1859.79 and 200 SMA @ 1786.73.
| Trends | Trends.1 | |
|---|---|---|
| 0 | Daily SMA20 | 1953.84 |
| 1 | Daily SMA50 | 1897.26 |
| 2 | Daily SMA100 | 1859.79 |
| 3 | Daily SMA200 | 1786.73 |
The previous day high was 2032.11 while the previous day low was 2010.08. The daily 38.2% Fib levels comes at 2023.69, expected to provide resistance. Similarly, the daily 61.8% fib level is at 2018.5, expected to provide resistance.
Note the levels of interest below:
- Pivot support is noted at 2009.9, 1998.98, 1987.87
- Pivot resistance is noted at 2031.93, 2043.04, 2053.96
| Levels | Levels.1 |
|---|---|
| Previous Daily High | 2032.11 |
| Previous Daily Low | 2010.08 |
| Previous Weekly High | 1987.70 |
| Previous Weekly Low | 1944.08 |
| Previous Monthly High | 2009.88 |
| Previous Monthly Low | 1809.46 |
| Daily Fibonacci 38.2% | 2023.69 |
| Daily Fibonacci 61.8% | 2018.50 |
| Daily Pivot Point S1 | 2009.90 |
| Daily Pivot Point S2 | 1998.98 |
| Daily Pivot Point S3 | 1987.87 |
| Daily Pivot Point R1 | 2031.93 |
| Daily Pivot Point R2 | 2043.04 |
| Daily Pivot Point R3 | 2053.96 |
[/s2If]
Join Our Telegram Group
")


