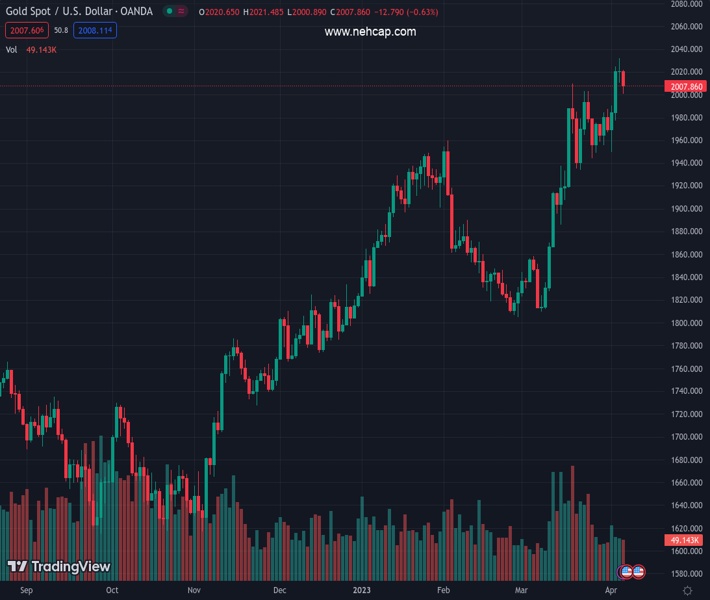
#XAUUSD @ 2,007.65 Gold price remains on the way to snapping two-week downtrend despite recent fall., @nehcap view: Pullback expected (Pivot Orderbook analysis)
…
This is a premium post.
[s2If !current_user_can(access_s2member_level4)]Please register for PREMIUM VERSION HERE to read full post below containing analysis. In case of any error or you think you are not able to read the full post below, please email us at support#nehcap.com [lwa][/s2If] [s2If current_user_can(access_s2member_level4)]
- Gold price remains on the way to snapping two-week downtrend despite recent fall.
- XAU/USD prints the biggest daily loss in two weeks amid recession woes, cautious mood ahead of United States Nonfarm Payrolls.
- US Dollar weakness keeps Gold buyers hopeful but it all depends upon NFP amid recently disappointments from US data.
- XAU/USD can seesaw on US employment statistics amid lack of liquidity due to Good Friday.
The pair currently trades last at 2007.65.
The previous day high was 2032.11 while the previous day low was 2010.08. The daily 38.2% Fib levels comes at 2023.69, expected to provide resistance. Similarly, the daily 61.8% fib level is at 2018.5, expected to provide resistance.
Gold price (XAU/USD) remains defensive at $2,007 during the early hours of Good Friday, after falling the most in a fortnight. In addition to the holiday-driven lack of liquidity, the cautious mood ahead of the top-tier United States employment data for March also restricts the XAU/USD moves. It’s worth noting that the fears of recession recently weighed on the Gold price even if the US Dollar struggles to recover, mainly due to the downbeat US statistics.
Gold price snapped a three-day uptrend and marked the biggest daily loss in nearly two weeks as consecutive weakness in the United States data and downbeat US Treasury bond yields triggered fears of a recession in the world’s largest economy.
Talking about the latest US employment data, US Initial Jobless Claims improved to 228K for the week ended on March 31 versus 200K expected and upwardly revised 246K prior. It’s worth noting that the Challenger Job Cuts for the said month rose to 89.703K from 77.77K prior. Previously, US JOLTS Job Openings dropped to the 19-month low in February while the ADP Employment Change for March also disappointed markets with 145K figures. Further, the US ISM Services PMI for March also amplified pessimism as it dropped to 51.2 versus 54.5 expected and 55.1 prior.
Elsewhere, Reuters recently flagged fears of recession by citing the Federal Reserve (Fed) Chairman Jerome Powell’s the preferred bond market indicator’s latest slump. “Research from the Fed has argued that the ‘near-term forward spread’ comparing the forward rate on Treasury bills 18 months from now with the current yield on a three-month Treasury bill was the most reliable bond market signal of an imminent economic contraction,” said the news.
Amid these plays, Wall Street licks its wounds while the US 10-year and two-year Treasury bond yields also stay pressured, despite the latest consolidation around 3.30% and 3.83% in that order.
Given the looming fears of recession, Gold traders will have to closely examine the incoming US employment data to trade better.
Not only the looming fears of the economic slowdown that recently challenged the Gold buyers, but escalating geopolitical fears surrounding the US, China, Russia and North Korea also seem to poke the XAU/USD prices.
China’s criticism of the US-Taiwan ties and dislike of the White House competition hints at worsening relations among the world’s top two economies, namely the US and China. The same should weigh on the Gold price considering China’s status as one of the world’s biggest Gold consumers, as well as due to the likely US Dollar’s haven demand.
In addition to the US-China tension, the Ukraine-Russia war and Moscow’s tussle with the West, as well as North Korea’s warning to use nuclear powers, also roil the geopolitical context and prod the Gold buyers.
In contrast to the aforementioned catalysts, the latest moves in the market against the US Dollar’s reserve currency status seem to allow the Gold price to stay on the bull’s radar amid the downbeat greenback.
Russia’s latest likes for the Chinese Yuan and the China-Brazil pact to ignore the US Dollar as an intermediate currency are a key news that recently challenges the greenback’s imperial status.
Adding strength to the Gold’s likelihood are the chatters that some of the US Congressmen have proposed a Gold Standard Restoration Act to defend the US Dollar. The bill suggests re-pegging the greenback with a fixed amount of the Gold’s weight, like it was before 1971.
Looking forward, Gold price relies on how the United States employment data arrives for March, especially amid recession woes and receding hawkish Fed bets.
Market forecasts suggest a softer print of the headline Nonfarm Payrolls (NFP), to 240K from 311K prior, as well as no change in the Unemployment Rate of 3.6%. However, the mixed expectations for the Average Hourly Earnings make the outcome even more interesting for Gold traders.
Should the scheduled US jobs report arrive as disappointing, the Gold price may witness further upside in case of downbeat US data.
Also read: US March Nonfarm Payrolls Preview: Analyzing Gold price’s reaction to NFP surprises
Gold price fades upside break of a three-week-old horizontal resistance, now immediate support around $2,005, as it lures sellers ahead of the key United States data.
Adding strength to the pullback bias are the bearish signals from the Moving Average Convergence and Divergence (MACD) indicator, as well as a retreat by the Relative Strength Index (RSI) line, placed 14, from the overbought territory.
With this, the Gold price is well-set to break the immediate support, which in turn can direct the quote toward the 100-bar Simple Moving Average (SMA) of around $1,971.
However, a horizontal area from mid-March and the 200-SMA, respectively near $1,935 and $1,906, could challenge the XAU/USD bears before giving them control.
On the contrary, recovery moves need to defy Wednesday’s Doji candlestick by crossing the latest peak of around $2,032.
Following that, the 61.8% Fibonacci Expansion (FE) of March 10-21 moves, near $2,045, which can please the Gold buyers.
Though, the year 2022 peak of $2,070 will precede the all-time high of $2,075 marked in 2020 to act as the final defense of the Gold bears.
Overall, Gold buyers are running out of steam but the bears have a long and bumpy road to travel before taking control.
Trend: Pullback expected
Technical Levels: Supports and Resistances
XAUUSD currently trading at 2007.82 at the time of writing. Pair opened at 2020.83 and is trading with a change of -0.64% % .
| Overview | Overview.1 | |
|---|---|---|
| 0 | Today last price | 2007.82 |
| 1 | Today Daily Change | -13.01 |
| 2 | Today Daily Change % | -0.64% |
| 3 | Today daily open | 2020.83 |
The pair remains strongly bullish on the daily timeframe. It trades above its 20 SMA @ 1953.84, 50 SMA 1897.26, 100 SMA @ 1859.79 and 200 SMA @ 1786.73.
| Trends | Trends.1 | |
|---|---|---|
| 0 | Daily SMA20 | 1953.84 |
| 1 | Daily SMA50 | 1897.26 |
| 2 | Daily SMA100 | 1859.79 |
| 3 | Daily SMA200 | 1786.73 |
The previous day high was 2032.11 while the previous day low was 2010.08. The daily 38.2% Fib levels comes at 2023.69, expected to provide resistance. Similarly, the daily 61.8% fib level is at 2018.5, expected to provide resistance.
Note the levels of interest below:
- Pivot support is noted at 2009.9, 1998.98, 1987.87
- Pivot resistance is noted at 2031.93, 2043.04, 2053.96
| Levels | Levels.1 |
|---|---|
| Previous Daily High | 2032.11 |
| Previous Daily Low | 2010.08 |
| Previous Weekly High | 1987.70 |
| Previous Weekly Low | 1944.08 |
| Previous Monthly High | 2009.88 |
| Previous Monthly Low | 1809.46 |
| Daily Fibonacci 38.2% | 2023.69 |
| Daily Fibonacci 61.8% | 2018.50 |
| Daily Pivot Point S1 | 2009.90 |
| Daily Pivot Point S2 | 1998.98 |
| Daily Pivot Point S3 | 1987.87 |
| Daily Pivot Point R1 | 2031.93 |
| Daily Pivot Point R2 | 2043.04 |
| Daily Pivot Point R3 | 2053.96 |
[/s2If]
Join Our Telegram Group
")


