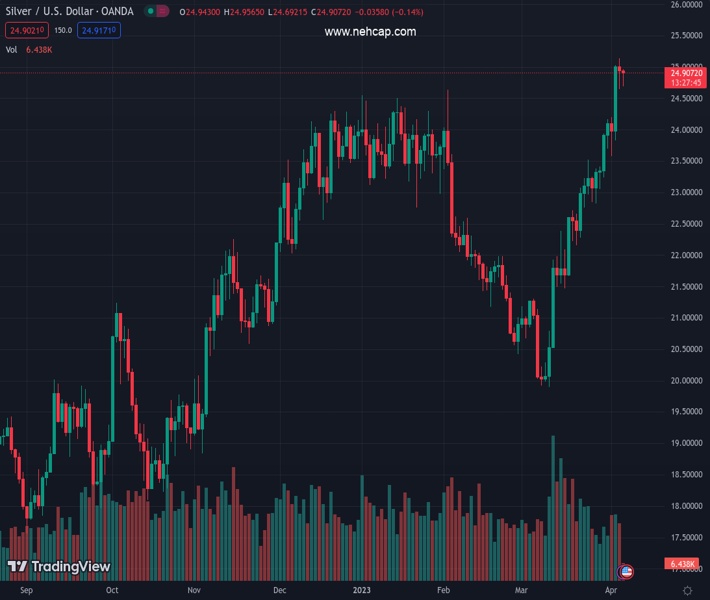
#XAGUSD @ 24.902 Silver edges lower for the second successive day, albeit lacks follow-through selling. (Pivot Orderbook analysis)
…
This is a premium post.
[s2If !current_user_can(access_s2member_level4)]Please register for PREMIUM VERSION HERE to read full post below containing analysis. In case of any error or you think you are not able to read the full post below, please email us at support#nehcap.com [lwa][/s2If] [s2If current_user_can(access_s2member_level4)]
- Silver edges lower for the second successive day, albeit lacks follow-through selling.
- The technical setup favours bullish traders and supports prospects for further gains.
- Dips could be seen as a buying opportunity near the $24.40-30 resistance breakpoint.
The pair currently trades last at 24.902.
The previous day high was 25.14 while the previous day low was 24.64. The daily 38.2% Fib levels comes at 24.83, expected to provide support. Similarly, the daily 61.8% fib level is at 24.95, expected to provide resistance.
Silver trades with a mild negative bias for the second successive day on Wednesday, though the lack of follow-through selling warrants some caution for aggressive bearish traders. The white metal manages to hold above the overnight swing low and hovers around the $24.80-$24.85 region during the early European session.
From a technical perspective, the downtick could be solely attributed to some profit-taking amid a slightly overbought Relative Strength Index (RSI) on the daily chart. That said, this week’s sustained move and acceptance above the $24.30-$24.40 strong horizontal barrier was seen as a fresh trigger for bulls. Moreover, the XAG/USD, so far, has managed to hold its neck above the previous YTD peak, around the $24.65 zone, and seems poised to prolong its recent upward trajectory witnessed over the past month or so.
Hence, any further pullback is likely to attract fresh buyers and remain limited near the $24.40-$24.30 resistance breakpoint, now turned support. The said area should now act as a pivotal point, which if broken decisively might prompt some technical selling and make the XAG/USD vulnerable to weaken below the $24.00 mark, towards testing the weekly low, around the $23.60-$23.55 area. The corrective decline could get extended further towards the $23.15 intermediate support en route to the $23.00 round-figure mark.
Bullish traders, meanwhile, might now wait for some follow-through buying beyond the $25.10-$25.15 region, or a nearly one-year high touched on Wednesday, before placing fresh bets. The XAG/USD might then aim to surpass an intermediate barrier near the $25.35-$25.40 zone and reclaim the $26.00 round-figure mark for the first time since April 2022. The next relevant hurdle is pegged near the $26.20 area ahead of the $26.40-$26.50 region and the 2022 swing high, just ahead of the $27.00 round-figure mark.
Technical Levels: Supports and Resistances
XAGUSD currently trading at 24.84 at the time of writing. Pair opened at 24.94 and is trading with a change of -0.4 % .
| Overview | Overview.1 | |
|---|---|---|
| 0 | Today last price | 24.84 |
| 1 | Today Daily Change | -0.10 |
| 2 | Today Daily Change % | -0.40 |
| 3 | Today daily open | 24.94 |
The pair remains strongly bullish on the daily timeframe. It trades above its 20 SMA @ 22.81, 50 SMA 22.27, 100 SMA @ 22.68 and 200 SMA @ 21.09.
| Trends | Trends.1 | |
|---|---|---|
| 0 | Daily SMA20 | 22.81 |
| 1 | Daily SMA50 | 22.27 |
| 2 | Daily SMA100 | 22.68 |
| 3 | Daily SMA200 | 21.09 |
The previous day high was 25.14 while the previous day low was 24.64. The daily 38.2% Fib levels comes at 24.83, expected to provide support. Similarly, the daily 61.8% fib level is at 24.95, expected to provide resistance.
Note the levels of interest below:
- Pivot support is noted at 24.67, 24.41, 24.18
- Pivot resistance is noted at 25.17, 25.4, 25.66
| Levels | Levels.1 |
|---|---|
| Previous Daily High | 25.14 |
| Previous Daily Low | 24.64 |
| Previous Weekly High | 24.16 |
| Previous Weekly Low | 22.83 |
| Previous Monthly High | 24.16 |
| Previous Monthly Low | 19.90 |
| Daily Fibonacci 38.2% | 24.83 |
| Daily Fibonacci 61.8% | 24.95 |
| Daily Pivot Point S1 | 24.67 |
| Daily Pivot Point S2 | 24.41 |
| Daily Pivot Point S3 | 24.18 |
| Daily Pivot Point R1 | 25.17 |
| Daily Pivot Point R2 | 25.40 |
| Daily Pivot Point R3 | 25.66 |
[/s2If]
Join Our Telegram Group
")


