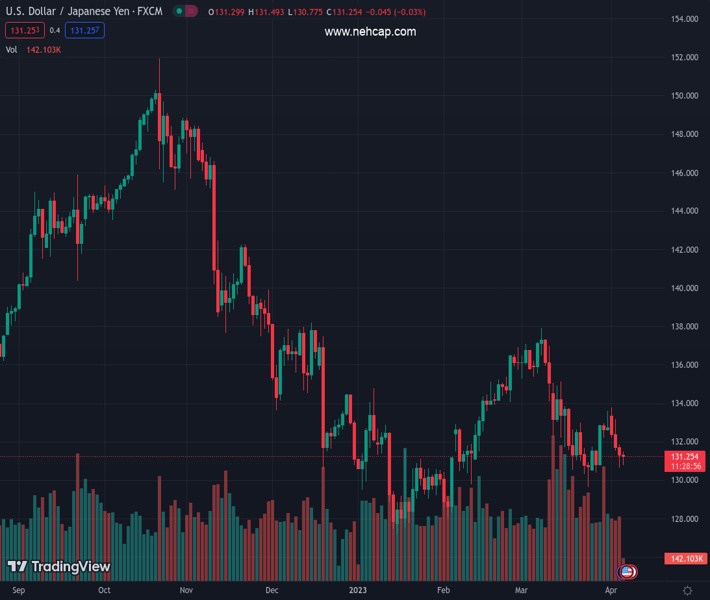
#USDJPY @ 131.243 bounces off a daily low amid a modest USD uptick, albeit lacks any follow-through buying. (Pivot Orderbook analysis)
…
This is a premium post.
[s2If !current_user_can(access_s2member_level4)]Please register for PREMIUM VERSION HERE to read full post below containing analysis. In case of any error or you think you are not able to read the full post below, please email us at support#nehcap.com [lwa][/s2If] [s2If current_user_can(access_s2member_level4)]
- USD/JPY bounces off a daily low amid a modest USD uptick, albeit lacks any follow-through buying.
- Bets for an imminent Fed rate-hike pause keep a lid on the buck and act as a headwind for the pair.
- The narrowing of the US-Japan rate-differential benefits the JPY and contributes to capping the upside.
The pair currently trades last at 131.243.
The previous day high was 131.85 while the previous day low was 130.63. The daily 38.2% Fib levels comes at 131.1, expected to provide support. Similarly, the daily 61.8% fib level is at 131.38, expected to provide resistance.
The USD/JPY pair attracts some dip-buying near the 130.80-130.75 region on Thursday and builds on its steady intraday ascent through the early part of the European session. The pair, for now, seems to have stalled this week’s rejection slide from the 100-day Simple Moving Average (SMA), though seems to struggle to capitalize on the momentum beyond mid-131.00s.
The US Dollar (USD) edges higher for the second successive day and looks to build on the overnight modest recovery from over a two-month low, which, in turn, acts as a tailwind for the USD/JPY pair. Apart from this, signs of stability in the equity markets undermine the safe-haven Japanese Yen (JPY) and lend additional support to the major. That said, rising bets for an imminent pause in the Federal Reserve’s (Fed) rate-hiking cycle hold back the USD bulls from placing aggressive bets and cap gains for the pair.
Investors now seem convinced that the Fed is nearly done with its inflation-fighting interest rate hikes. In fact, the current market pricing indicates an even chance of a 25 bps lift-off at the May policy meeting and the possibility of rate cuts by year-end. The bets were reaffirmed by the disappointing release of the US ADP report on Wednesday, showing that private-sector employers added 145K jobs in March as compared to the 200K anticipated. The data suggested that the Fed’s efforts to cool the labor market could be having some impact.
This, in turn, keeps the US Treasury bond yields depressed near their lowest level in seven months. This results in the narrowing of the US-Japan rate differential, which drives some flows towards the JPY and contributes to keeping a lid on any meaningful upside for the USD/JPY pair. Traders also seem reluctant ahead of the release of the closely-watched US jobs data, or the NFP report on Friday. In the meantime, the US Weekly Initial Jobless Claims might provide some impetus later during the early North American session on Thursday.
Technical Levels: Supports and Resistances
USDJPY currently trading at 131.28 at the time of writing. Pair opened at 131.32 and is trading with a change of -0.03 % .
| Overview | Overview.1 | |
|---|---|---|
| 0 | Today last price | 131.28 |
| 1 | Today Daily Change | -0.04 |
| 2 | Today Daily Change % | -0.03 |
| 3 | Today daily open | 131.32 |
The pair remains strongly bearish on the daily time frame. It trades below the 20 SMA @ 132.52, 50 SMA 133.05, 100 SMA @ 133.64 and 200 SMA @ 137.26.
| Trends | Trends.1 | |
|---|---|---|
| 0 | Daily SMA20 | 132.52 |
| 1 | Daily SMA50 | 133.05 |
| 2 | Daily SMA100 | 133.64 |
| 3 | Daily SMA200 | 137.26 |
The previous day high was 131.85 while the previous day low was 130.63. The daily 38.2% Fib levels comes at 131.1, expected to provide support. Similarly, the daily 61.8% fib level is at 131.38, expected to provide resistance.
Note the levels of interest below:
- Pivot support is noted at 130.68, 130.05, 129.47
- Pivot resistance is noted at 131.9, 132.48, 133.11
| Levels | Levels.1 |
|---|---|
| Previous Daily High | 131.85 |
| Previous Daily Low | 130.63 |
| Previous Weekly High | 133.60 |
| Previous Weekly Low | 130.41 |
| Previous Monthly High | 137.91 |
| Previous Monthly Low | 129.64 |
| Daily Fibonacci 38.2% | 131.10 |
| Daily Fibonacci 61.8% | 131.38 |
| Daily Pivot Point S1 | 130.68 |
| Daily Pivot Point S2 | 130.05 |
| Daily Pivot Point S3 | 129.47 |
| Daily Pivot Point R1 | 131.90 |
| Daily Pivot Point R2 | 132.48 |
| Daily Pivot Point R3 | 133.11 |
[/s2If]
Join Our Telegram Group
")


