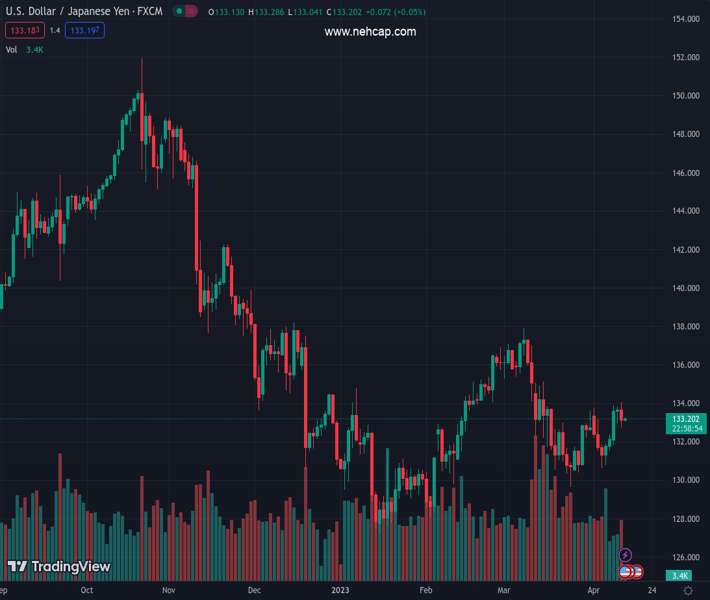
#USDJPY @ 131.211 portrays bearish consolidation during four-day downtrend, picks up bids of late. (Pivot Orderbook analysis)
…
This is a premium post.
[s2If !current_user_can(access_s2member_level4)]Please register for PREMIUM VERSION HERE to read full post below containing analysis. In case of any error or you think you are not able to read the full post below, please email us at support#nehcap.com [lwa][/s2If] [s2If current_user_can(access_s2member_level4)]
- USD/JPY portrays bearish consolidation during four-day downtrend, picks up bids of late.
- Fears of economic slowdown underpin US Dollar rebound despite downbeat data, yields stay pressured at weekly low.
- Hawkish BoJ concerns contradict dovish shift in Fed bets to weigh on Yen price.
- Second-tier US employment data eyed ahead of Friday’s key Nonfarm Payrolls.
The pair currently trades last at 131.211.
The previous day high was 131.85 while the previous day low was 130.63. The daily 38.2% Fib levels comes at 131.1, expected to provide support. Similarly, the daily 61.8% fib level is at 131.38, expected to provide resistance.
USD/JPY consolidates intraday losses around 131.20 as the US Dollar defends the previous day’s rebound from two-month low heading into Thursday’s European session. Even so, the Yen pair remains on the way to reversing the last week’s gains, the first in five, amid downbeat Treasury bond yields.
A likely monetary policy divergence between the Bank of Japan (BoJ) and the US Federal Reserve (Fed) appears to weigh on the Yen pair of late. The talks of the BoJ’s exit from easy money policy under the new Governor reign, especially when there prevails the need to reverse the 1.55 quadrillion yen ($11.7 trillion) of stimulus introduced during the last 10 years of Kuroda’s leadership.
On the other hand, CME’s FedWatch Tool suggests a nearly 57.0% of chance that the US central bank will pause its rate hike trajectory in May.
Even so, recession woes emanating from consecutive weakness in the US employment numbers and contagion risk associated with the same weigh on the sentiment while allowing the US Dollar to lick its wounds. That said, US Dollar Index (DXY) extends the previous day’s rebound from a two-month low to 102.00 by the press time, up 0.12% intraday.
It should be noted that the US JOLTS Job Openings for February previously slumped to the lowest levels in 19 months and bolstered job fears while ADP Employment Change for March dropped to 145K from 200K expected and an upwardly revised prior of 261K. On the same line, the final readings of S&P Global Composite and Services PMIs for March also came in downbeat as the former one declined to 52.3 from 53.3 preliminary estimations while the Services PMI dropped to 52.6 from 53.8 anticipated earlier. More importantly, the US ISM Services PMI for the said month amplified pessimism as it dropped to 51.2 versus 54.5 expected and 55.1 prior.
Elsewhere, geopolitical fears emanating from China and North Korea also weigh on the sentiment and allow the US Dollar to remain firmer.
Amid these plays, &P 500 Futures drop for the third consecutive day even if the benchmark US Treasury bond yields remain sluggish around the multi-day bottom. That said, the US 10-year Treasury bond yields dropped in the last five consecutive days to refresh a seven-month low on Wednesday while the two-year counterpart also printed a four-day downtrend.
Looking forward, headlines surrounding China and the second-tier US employment data.
A daily closing below an 11-week-old support line, around 130.95 by the press time, becomes necessary for the USD/JPY bear’s conviction.
Technical Levels: Supports and Resistances
USDJPY currently trading at 131.24 at the time of writing. Pair opened at 131.32 and is trading with a change of -0.06 % .
| Overview | Overview.1 | |
|---|---|---|
| 0 | Today last price | 131.24 |
| 1 | Today Daily Change | -0.08 |
| 2 | Today Daily Change % | -0.06 |
| 3 | Today daily open | 131.32 |
The pair remains strongly bearish on the daily time frame. It trades below the 20 SMA @ 132.52, 50 SMA 133.05, 100 SMA @ 133.64 and 200 SMA @ 137.26.
| Trends | Trends.1 | |
|---|---|---|
| 0 | Daily SMA20 | 132.52 |
| 1 | Daily SMA50 | 133.05 |
| 2 | Daily SMA100 | 133.64 |
| 3 | Daily SMA200 | 137.26 |
The previous day high was 131.85 while the previous day low was 130.63. The daily 38.2% Fib levels comes at 131.1, expected to provide support. Similarly, the daily 61.8% fib level is at 131.38, expected to provide resistance.
Note the levels of interest below:
- Pivot support is noted at 130.68, 130.05, 129.47
- Pivot resistance is noted at 131.9, 132.48, 133.11
| Levels | Levels.1 |
|---|---|
| Previous Daily High | 131.85 |
| Previous Daily Low | 130.63 |
| Previous Weekly High | 133.60 |
| Previous Weekly Low | 130.41 |
| Previous Monthly High | 137.91 |
| Previous Monthly Low | 129.64 |
| Daily Fibonacci 38.2% | 131.10 |
| Daily Fibonacci 61.8% | 131.38 |
| Daily Pivot Point S1 | 130.68 |
| Daily Pivot Point S2 | 130.05 |
| Daily Pivot Point S3 | 129.47 |
| Daily Pivot Point R1 | 131.90 |
| Daily Pivot Point R2 | 132.48 |
| Daily Pivot Point R3 | 133.11 |
[/s2If]
Join Our Telegram Group
")


