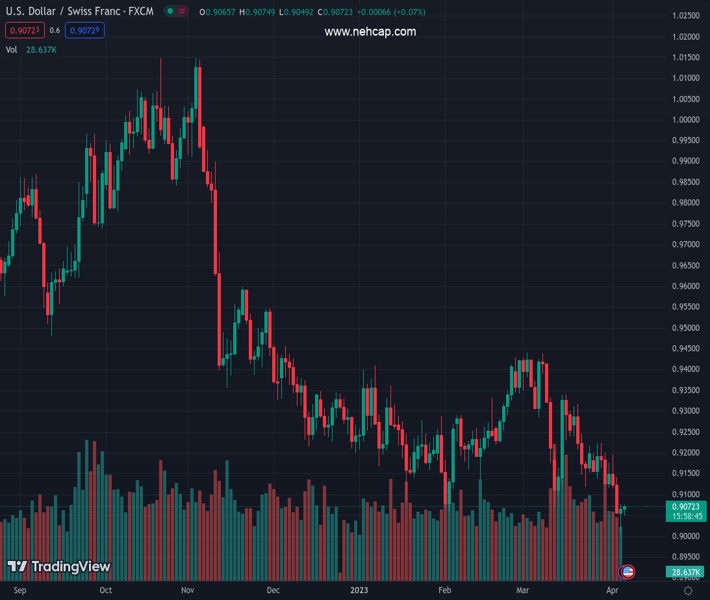
#USDCHF @ 0.90715 picks up bids to extend the previous day’s rebound from 22-month low., @nehcap view: Further recovery expected (Pivot Orderbook analysis)
…
This is a premium post.
[s2If !current_user_can(access_s2member_level4)]Please register for PREMIUM VERSION HERE to read full post below containing analysis. In case of any error or you think you are not able to read the full post below, please email us at support#nehcap.com [lwa][/s2If] [s2If current_user_can(access_s2member_level4)]
- USD/CHF picks up bids to extend the previous day’s rebound from 22-month low.
- Upside break of weekly resistance line, looming bull cross on MACD favor Swiss Franc sellers.
- Two-month-old previous support line appears crucial for USD/CHF bulls; 100-SMA acts as the last defense of bears.
The pair currently trades last at 0.90715.
The previous day high was 0.9076 while the previous day low was 0.9007. The daily 38.2% Fib levels comes at 0.905, expected to provide support. Similarly, the daily 61.8% fib level is at 0.9034, expected to provide support.
USD/CHF lures buyers around 0.9075 as it pierces a downward-sloping resistance line from Monday amid early Thursday in Europe. In doing so, the Swiss Franc (CHF) pair extends the previous day’s recovery moves from the lowest levels since June 2021 amid a sluggish session.
That said, a clear upside break of the immediate resistance line joins an impending bull cross on the MACD to lure USD/CHF buyers. However, the previous support line from early February, around 0.9080 by the press time, challenges the quote’s recovery.
Should the USD/CHF pair remains firmer past 0.9080, a one-month-old resistance line, around 0.9155, precedes the 100-SMA level of around 0.9190 to act as the last defense of the pair sellers.
In a case where the quote rises past 0.9190, and also crosses the 0.9200 round figure, it can aim for the mid-March high of 0.9342.
Meanwhile, the immediate resistance-turned-support line near 0.9070 restricts the immediate downside of the USD/CHF price ahead of the latest bottom surrounding 0.9005. Also acting as a downside filter is the 0.9000 psychological magnet, a break of which could drag the pair toward June 2021 low surrounding 0.8925.
Overall, USD/CHF is likely to consolidate recent losses near the multi-month low but the bullish trend is far from sight.
Trend: Further recovery expected
Technical Levels: Supports and Resistances
USDCHF currently trading at 0.9072 at the time of writing. Pair opened at 0.907 and is trading with a change of 0.02% % .
| Overview | Overview.1 | |
|---|---|---|
| 0 | Today last price | 0.9072 |
| 1 | Today Daily Change | 0.0002 |
| 2 | Today Daily Change % | 0.02% |
| 3 | Today daily open | 0.907 |
The pair remains strongly bearish on the daily time frame. It trades below the 20 SMA @ 0.9191, 50 SMA 0.9242, 100 SMA @ 0.9287 and 200 SMA @ 0.9512.
| Trends | Trends.1 | |
|---|---|---|
| 0 | Daily SMA20 | 0.9191 |
| 1 | Daily SMA50 | 0.9242 |
| 2 | Daily SMA100 | 0.9287 |
| 3 | Daily SMA200 | 0.9512 |
The previous day high was 0.9076 while the previous day low was 0.9007. The daily 38.2% Fib levels comes at 0.905, expected to provide support. Similarly, the daily 61.8% fib level is at 0.9034, expected to provide support.
Note the levels of interest below:
- Pivot support is noted at 0.9026, 0.8982, 0.8957
- Pivot resistance is noted at 0.9096, 0.9121, 0.9165
| Levels | Levels.1 |
|---|---|
| Previous Daily High | 0.9076 |
| Previous Daily Low | 0.9007 |
| Previous Weekly High | 0.9224 |
| Previous Weekly Low | 0.9116 |
| Previous Monthly High | 0.9440 |
| Previous Monthly Low | 0.9072 |
| Daily Fibonacci 38.2% | 0.9050 |
| Daily Fibonacci 61.8% | 0.9034 |
| Daily Pivot Point S1 | 0.9026 |
| Daily Pivot Point S2 | 0.8982 |
| Daily Pivot Point S3 | 0.8957 |
| Daily Pivot Point R1 | 0.9096 |
| Daily Pivot Point R2 | 0.9121 |
| Daily Pivot Point R3 | 0.9165 |
[/s2If]
Join Our Telegram Group
")


