#NZDUSD @ 0.63001 licks its wounds during the first daily negative in four. (Pivot Orderbook analysis)
…
This is a premium post.
[s2If !current_user_can(access_s2member_level4)]Please register for PREMIUM VERSION HERE to read full post below containing analysis. In case of any error or you think you are not able to read the full post below, please email us at support#nehcap.com [lwa][/s2If] [s2If current_user_can(access_s2member_level4)]
- NZD/USD licks its wounds during the first daily negative in four.
- China Caixin Services PMI rises to the highest levels since November 2020.
- Risk-off mood previously allowed Kiwi pair to consolidate RBNZ-led gains.
- Downbeat US data, yields keep Kiwi buyers hopeful ahead of US employment numbers.
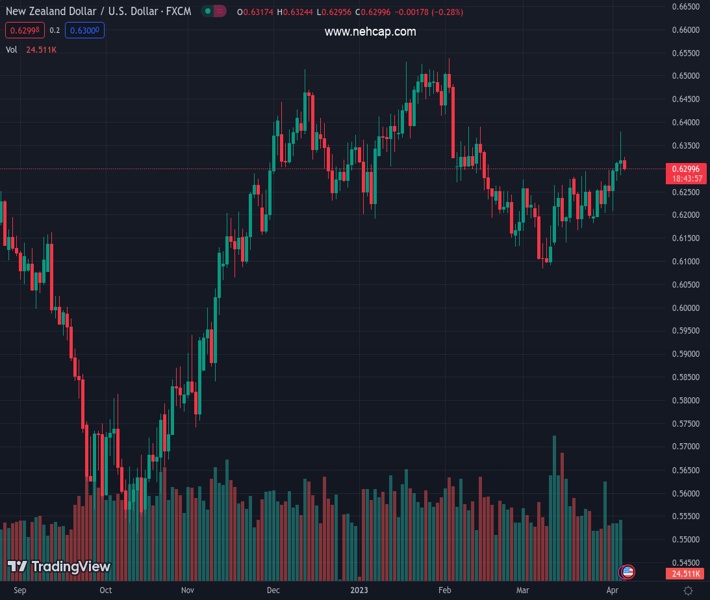
The pair currently trades last at 0.63001.
The previous day high was 0.6386 while the previous day low was 0.6285. The daily 38.2% Fib levels comes at 0.6348, expected to provide resistance. Similarly, the daily 61.8% fib level is at 0.6324, expected to provide resistance.
NZD/USD flirts with the 0.6300 round figure during its first loss-making day in four amid early Thursday. While the broad risk aversion underpins the US Dollar’s corrective bounce and weigh on the Kiwi pair, the hawkish bias surrounding the Reserve Bank of New Zealand (RBNZ) joins strong China activity data to prod the bears.
Recently, China’s Caixin Services PMI rallied to 57.8 versus 54.0 expected 55.0 prior. In doing so, the China data rises to the highest level since November 2020.
It’s worth noting that the NZD/USD price jumped to the seven-week high the previous day as the RBNZ surprised markets with 0.50% rate hike. However, downbeat US data triggered recession woes afterward and weighed on the quote. Also likely to have exerted downside pressure on the NZD/USD are the geopolitical fears surrounding Taiwan and North Korea.
That said, a disappointing 19-month low of the US JOLTS Job Openings for February precedes the ADP Employment Change for March which dropped to 145K from 200K expected and an upwardly revised prior of 261K. On the same line, the final readings of S&P Global Composite and Services PMIs for March also came in downbeat as the former one declined to 52.3 from 53.3 preliminary estimations while the Services PMI dropped to 52.6 from 53.8 anticipated earlier. More importantly, the US ISM Services PMI for the said month amplified pessimism as it dropped to 51.2 versus 54.5 expected and 55.1 prior.
Elsewhere, US House of Representatives Speaker Kevin McCarthy’s talks with Taiwanese President Tsai Ing-Wen renewed the Sino-American tussles. On the other hand, North Korea on Thursday accused the U.S. and South Korea of escalating tensions to the brink of nuclear war through their joint military drills, vowing to respond with “offensive action,” state media KCNA reported per Reuters.
Against this backdrop, S&P 500 Futures drop for the third consecutive day even if the benchmark US Treasury bond yields remain sluggish around the multi-day bottom but the US Dollar Index (DXY) grinds higher to 101.98 by the press time.
Looking ahead, the weekly US jobless claims data will be important for fresh impulse before Friday’s all-important Nonfarm Payrolls (NFP).
NZD/USD remains on the way to testing the one-month-old support line, around 0.6245 by the press time, unless breaking a two-month-old 0.6385-90 resistance area
Technical Levels: Supports and Resistances
NZDUSD currently trading at 0.6301 at the time of writing. Pair opened at 0.6319 and is trading with a change of -0.28% % .
| Overview | Overview.1 | |
|---|---|---|
| 0 | Today last price | 0.6301 |
| 1 | Today Daily Change | -0.0018 |
| 2 | Today Daily Change % | -0.28% |
| 3 | Today daily open | 0.6319 |
The pair remains strongly bullish on the daily timeframe. It trades above its 20 SMA @ 0.6229, 50 SMA 0.6268, 100 SMA @ 0.63 and 200 SMA @ 0.616.
| Trends | Trends.1 | |
|---|---|---|
| 0 | Daily SMA20 | 0.6229 |
| 1 | Daily SMA50 | 0.6268 |
| 2 | Daily SMA100 | 0.6300 |
| 3 | Daily SMA200 | 0.6160 |
The previous day high was 0.6386 while the previous day low was 0.6285. The daily 38.2% Fib levels comes at 0.6348, expected to provide resistance. Similarly, the daily 61.8% fib level is at 0.6324, expected to provide resistance.
Note the levels of interest below:
- Pivot support is noted at 0.6274, 0.6229, 0.6173
- Pivot resistance is noted at 0.6375, 0.6431, 0.6476
| Levels | Levels.1 |
|---|---|
| Previous Daily High | 0.6386 |
| Previous Daily Low | 0.6285 |
| Previous Weekly High | 0.6298 |
| Previous Weekly Low | 0.6180 |
| Previous Monthly High | 0.6298 |
| Previous Monthly Low | 0.6084 |
| Daily Fibonacci 38.2% | 0.6348 |
| Daily Fibonacci 61.8% | 0.6324 |
| Daily Pivot Point S1 | 0.6274 |
| Daily Pivot Point S2 | 0.6229 |
| Daily Pivot Point S3 | 0.6173 |
| Daily Pivot Point R1 | 0.6375 |
| Daily Pivot Point R2 | 0.6431 |
| Daily Pivot Point R3 | 0.6476 |
[/s2If]
Join Our Telegram Group
")


