#AUDUSD @ 0.66973 has surrendered the immediate support of 0.6700 as US-China tension has strengthened the risk-off mood. (Pivot Orderbook analysis)
…
This is a premium post.
[s2If !current_user_can(access_s2member_level4)]Please register for PREMIUM VERSION HERE to read full post below containing analysis. In case of any error or you think you are not able to read the full post below, please email us at support#nehcap.com [lwa][/s2If] [s2If current_user_can(access_s2member_level4)]
- AUD/USD has surrendered the immediate support of 0.6700 as US-China tension has strengthened the risk-off mood.
- Federal Reserve to remain steady amid deepening US recession fears and cooling US labor market.
- Reserve Bank of Australia has kept doors open for more rate hikes in case Australian inflation continues to remain persistent.
- AUD/USD is auctioning in a Rising Channel chart pattern, however, weak momentum could weaken the Australian Dollar.
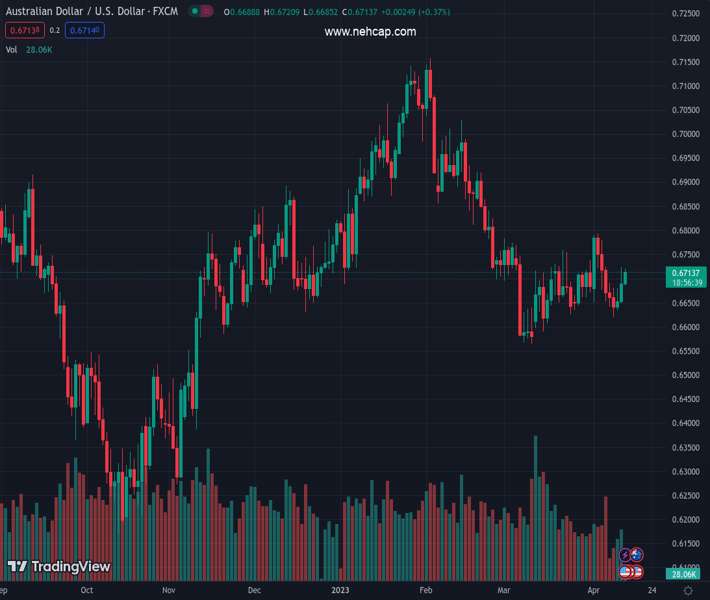
The pair currently trades last at 0.66973.
The previous day high was 0.678 while the previous day low was 0.6677. The daily 38.2% Fib levels comes at 0.6716, expected to provide resistance. Similarly, the daily 61.8% fib level is at 0.6741, expected to provide resistance.
AUD/USD has surrendered the round-level support of 0.6700 in the early European session. The Aussie asset is declining towards Wednesday’s low at 0.6675 as deepening United States-China tensions over Taiwan have trimmed the risk appetite of the market participants. US’s promise of delivering arms to Taiwan on a timely basis and strengthening economic cooperation on trade and technology has made China uneasy.
China’s Foreign Ministry Spokesperson made an allegation against the US after the commentary from US House of Representatives Speaker Kevin McCarthy for breaking commitment over the Taiwan issue. The event has triggered volatility for the Australian Dollar. It is worth noting that Australia is the leading trading partner of China and the deterioration of US-China relations would have a cascading effect on the Australian Dollar.
Escalating US-China tensions have trimmed the appeal for risk-perceived assets. S&P500 futures have stretched losses on expectations that US-China tensions could lead to some sanctions on the dragon economy. US equities have been registering bearish settlements for the past two trading sessions amid evidence of a slowdown in the US economy.
The US Dollar Index (DXY) looks firm above 102.00 and is expected to extend its recovery further. However, the slowing US labor market could restrict its upside. The demand for US government bonds is recovering quickly in hopes that the Federal Reserve (Fed) will consider an early pause to the policy-tightening spell. This has dragged 10-year US Treasury yields to near 3.29%.
On Wednesday, the US Automatic Data Processing (ADP) agency reported a decline in the number of job additions in the month of March. The US economy added 145K jobs in March, significantly lower than the estimates of 200K and the former release of 242K. Firms have slowed down their hiring process amid rising interest rates by the Federal Reserve (Fed) and a bleak economic outlook. A slowdown in the recruitment process after the release of weak Job Openings data indicates that the US labor market has started cooling off and chances are solid of an escalation in the Unemployment Rate ahead.
However, investors will get more clarity about the labor market condition after the release of the US Nonfarm Payrolls (NFP) data, which is scheduled for Good Friday. As per the consensus, the jobless rate is seen unchanged at 3.6%. An economic indicator that could prompt US consumer inflation expectations is the Average Hourly Earnings data. The street is anticipating a deceleration in the annual labor cost index to 4.3% from the former release of 4.6%. However, monthly wage data could accelerate by 0.3% against the former increment of 0.2%.
Considering the current monetary policy as restrictive enough to tame stubborn inflation, the Reserve Bank of Australia (RBA) kept interest rates unchanged at 3.6% in its monetary policy meeting on Tuesday. However, Reserve Bank of Australia Governor Philip Lowe has kept doors open for more rate hikes in case Australian inflation continues to remain persistent. It is worth noting that Australia’s monthly Consumer Price Index (CPI) has softened quickly to 6.8% from the peak of 8.4% recorded in December.
AUD/USD is auctioning in a Rising Channel chart pattern on a four-hour scale in which every corrective move is capitalized as a buying opportunity by investors. However, lack of momentum in the aforementioned chart pattern is advocating a downside move in the Aussie asset ahead.
The Australian Dollar has failed in keeping the asset above the 200-period Exponential Moving Average (EMA) at 0.6730, which indicates that the long-term trend is bearish.
Meanwhile, the Relative Strength Index (RSI) (14) is oscillating in the 40.00-60.00 range, indicating a consolidation. A scenario of slipping into the bearish range of 20.00-40.00 is highly likely.
Going forward, a break below April 03 low at 0.6650 will expose the Aussie asset to the round-level support at 0.6600. A crackdown below the round-level support would further drag the asset toward March 10 low at 0.6564.
Alternatively, downside bias for the Aussie asst would vanish if it manages to climb above April 03 high around 0.6800. An occurrence of the same will drive the asset toward February 23 high at 0.6842 followed by February 13 low at 0.6890.
Technical Levels: Supports and Resistances
AUDUSD currently trading at 0.6694 at the time of writing. Pair opened at 0.672 and is trading with a change of -0.39 % .
| Overview | Overview.1 | |
|---|---|---|
| 0 | Today last price | 0.6694 |
| 1 | Today Daily Change | -0.0026 |
| 2 | Today Daily Change % | -0.3900 |
| 3 | Today daily open | 0.6720 |
The pair is trading above its 20 Daily moving average @ 0.6679, below its 50 Daily moving average @ 0.6801 , below its 100 Daily moving average @ 0.68 and below its 200 Daily moving average @ 0.6749
| Trends | Trends.1 | |
|---|---|---|
| 0 | Daily SMA20 | 0.6679 |
| 1 | Daily SMA50 | 0.6801 |
| 2 | Daily SMA100 | 0.6800 |
| 3 | Daily SMA200 | 0.6749 |
The previous day high was 0.678 while the previous day low was 0.6677. The daily 38.2% Fib levels comes at 0.6716, expected to provide resistance. Similarly, the daily 61.8% fib level is at 0.6741, expected to provide resistance.
Note the levels of interest below:
- Pivot support is noted at 0.6672, 0.6623, 0.6568
- Pivot resistance is noted at 0.6775, 0.6829, 0.6878
| Levels | Levels.1 |
|---|---|
| Previous Daily High | 0.6780 |
| Previous Daily Low | 0.6677 |
| Previous Weekly High | 0.6738 |
| Previous Weekly Low | 0.6634 |
| Previous Monthly High | 0.6784 |
| Previous Monthly Low | 0.6564 |
| Daily Fibonacci 38.2% | 0.6716 |
| Daily Fibonacci 61.8% | 0.6741 |
| Daily Pivot Point S1 | 0.6672 |
| Daily Pivot Point S2 | 0.6623 |
| Daily Pivot Point S3 | 0.6568 |
| Daily Pivot Point R1 | 0.6775 |
| Daily Pivot Point R2 | 0.6829 |
| Daily Pivot Point R3 | 0.6878 |
[/s2If]
Join Our Telegram Group
")


