#AUDUSD @ 0.66724 The US labor market eases, as Initial Jobless Claims for April 1 rise to 228K, exceeding estimates of 200K (Pivot Orderbook analysis)
…
This is a premium post.
[s2If !current_user_can(access_s2member_level4)]Please register for PREMIUM VERSION HERE to read full post below containing analysis. In case of any error or you think you are not able to read the full post below, please email us at support#nehcap.com [lwa][/s2If] [s2If current_user_can(access_s2member_level4)]
- The US labor market eases, as Initial Jobless Claims for April 1 rise to 228K, exceeding estimates of 200K
- St. Louis Fed President Bullard notes stronger than expected Q1 data while warning of “sticky” inflation.
- US Nonfarm Payrolls are expected at 240K, while the Unemployment Rate is foreseen at 3.6%.
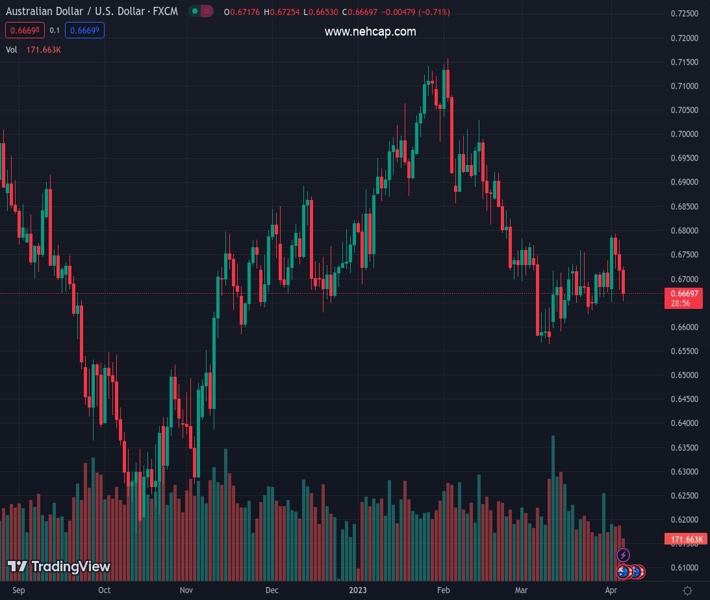
The pair currently trades last at 0.66724.
The previous day high was 0.678 while the previous day low was 0.6677. The daily 38.2% Fib levels comes at 0.6716, expected to provide resistance. Similarly, the daily 61.8% fib level is at 0.6741, expected to provide resistance.
The AUD/USD extends its losses to three consecutive days, as Wall Street is set to finish the week with gains, except for the Dow Jones, losing 0.02%. In the FX space, risk aversion was the main driver of the session, weakening high beta currencies, like the Australian Dollar (AUD), which tumbled 0.74% vs. the buck. At the time of writing, the AUD/USD is trading at 0.6671.
On Thursday, the North American session was characterized by fluctuating sentiment, though US equity bulls lifted the S&P 500 and the Nasdaq. The US economic docket features Initial Jobless Claims for April 1, which jumped to 228K, above estimates of 200K, but trailed the prior’s week, which was upward revised to 246K.
Since the beginning of the week, the employment index of the US PMIs has shown signs that hiring is decelerating. That was confirmed by the US JOLTs Opening report, which showed that vacancies shifted downwards. Therefore, growing speculations for a Federal Reserve’s (Fed) pause on its tightening cycle increased.
On Wednesday, the ADP Employment Change report for March showed that companies hired fewer employees than expected. Given the backdrop, the latest US labor market data has sparked worries that an upcoming US recession is around the corner.
Hence, the AUD/USD began Thursday’s session at around 0.6730s, the day’s high. Nevertheless, it resumed its downtrend, as the release of the US Nonfarm Payrolls report and the Good Friday holiday motivated traders to book profits.
OF late, the St. Louis Federal Reserve President James Bullard commented that Q1’s incoming data is more robust than expected, adding that financial conditions are less tighter than the 2007-2009 crisis. Bullard said inflation would be “sticky going forward” and that the Fed “needs to stay at it” to get inflation back to its 2% target.
An absent Australian economic docket will leave traders focused on the release of the US Nonfarm Payrolls. The US Bureau of Labor Statistics (BLS) will release the report on April 7 at 12:30 GMT. Most banks expect the US economy to add 240K jobs after a February increase of 311K. The Unemployment Rate is estimated to stay steady at 3.6%, while Average Hourly Earnings are declining to 4.3% YoY, vs. 4.6% in February.
Technical Levels: Supports and Resistances
AUDUSD currently trading at 0.6672 at the time of writing. Pair opened at 0.672 and is trading with a change of -0.71 % .
| Overview | Overview.1 | |
|---|---|---|
| 0 | Today last price | 0.6672 |
| 1 | Today Daily Change | -0.0048 |
| 2 | Today Daily Change % | -0.7100 |
| 3 | Today daily open | 0.6720 |
The pair remains strongly bearish on the daily time frame. It trades below the 20 SMA @ 0.6679, 50 SMA 0.6801, 100 SMA @ 0.68 and 200 SMA @ 0.6749.
| Trends | Trends.1 | |
|---|---|---|
| 0 | Daily SMA20 | 0.6679 |
| 1 | Daily SMA50 | 0.6801 |
| 2 | Daily SMA100 | 0.6800 |
| 3 | Daily SMA200 | 0.6749 |
The previous day high was 0.678 while the previous day low was 0.6677. The daily 38.2% Fib levels comes at 0.6716, expected to provide resistance. Similarly, the daily 61.8% fib level is at 0.6741, expected to provide resistance.
Note the levels of interest below:
- Pivot support is noted at 0.6672, 0.6623, 0.6568
- Pivot resistance is noted at 0.6775, 0.6829, 0.6878
| Levels | Levels.1 |
|---|---|
| Previous Daily High | 0.6780 |
| Previous Daily Low | 0.6677 |
| Previous Weekly High | 0.6738 |
| Previous Weekly Low | 0.6634 |
| Previous Monthly High | 0.6784 |
| Previous Monthly Low | 0.6564 |
| Daily Fibonacci 38.2% | 0.6716 |
| Daily Fibonacci 61.8% | 0.6741 |
| Daily Pivot Point S1 | 0.6672 |
| Daily Pivot Point S2 | 0.6623 |
| Daily Pivot Point S3 | 0.6568 |
| Daily Pivot Point R1 | 0.6775 |
| Daily Pivot Point R2 | 0.6829 |
| Daily Pivot Point R3 | 0.6878 |
[/s2If]
Join Our Telegram Group
")


