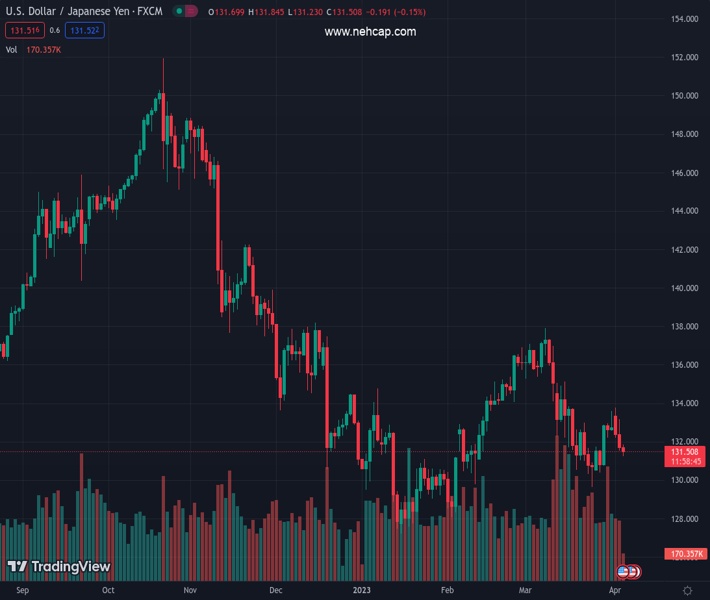
#USDJPY @ 131.481 drifts lower for the third successive day and drops to a one-week low. (Pivot Orderbook analysis)
…
This is a premium post.
[s2If !current_user_can(access_s2member_level4)]Please register for PREMIUM VERSION HERE to read full post below containing analysis. In case of any error or you think you are not able to read the full post below, please email us at support#nehcap.com [lwa][/s2If] [s2If current_user_can(access_s2member_level4)]
- USD/JPY drifts lower for the third successive day and drops to a one-week low.
- Rebounding US bond yields lends support to the USD and limit further losses.
- Traders look to the US ADP report and the ISM Services PMI for fresh impetus.
The pair currently trades last at 131.481.
The previous day high was 133.17 while the previous day low was 131.52. The daily 38.2% Fib levels comes at 132.15, expected to provide resistance. Similarly, the daily 61.8% fib level is at 132.54, expected to provide resistance.
The USD/JPY pair extends this week’s rejection slide from the 100-day Simple Moving Average (SMA) and remains under some selling pressure for the third successive day on Wednesday. The downward trajectory drags spot prices to a one-week low, around the 131.25-131.20 region during the first half of the European session.
A mildly softer tone around the equity markets benefits the safe-haven Japanese Yen (JPY) and is seen as a key factor exerting downward pressure on the USD/JPY pair. That said, a modest US Dollar (USD) bounce from over a two-month low, helped by an uptick in the US Treasury bond yields, lends some support and limits the downside for the major, at least for the time being. The fundamental backdrop, however, still seems tilted in favour of bearish traders, suggesting that any attempted recovery move is more likely to get sold into.
Investors now seem convinced that the Federal Reserve (Fed) is nearly done with its tightening cycle and have been pricing in an even chance of a 25 bps lift-off at the May FOMC meeting. Furthermore, market participants see the possibility of rate cuts by end-December and the bets were reaffirmed by the weaker US macro data on Tuesday, showing that job openings in February dropped to the lowest in nearly two years. This seems to act as a headwind for the US bond yields and is holding back the USD bulls from placing aggressive bets.
The aforementioned fundamental backdrop suggests that the path of least resistance for the USD/JPY pair is to the downside and a further slide towards the 131.00 mark, en route to the 130.70 support, looks like a distinct possibility. Traders now look to the US economic docket, featuring the release of the ADP report on private-sector employment and the ISM Services PMI, for some impetus later during the early North American session. The focus, meanwhile, remains on the closely-watched US jobs data – popularly known as the NFP – on Friday.
Technical Levels: Supports and Resistances
USDJPY currently trading at 131.41 at the time of writing. Pair opened at 131.7 and is trading with a change of -0.22 % .
| Overview | Overview.1 | |
|---|---|---|
| 0 | Today last price | 131.41 |
| 1 | Today Daily Change | -0.29 |
| 2 | Today Daily Change % | -0.22 |
| 3 | Today daily open | 131.70 |
The pair remains strongly bearish on the daily time frame. It trades below the 20 SMA @ 132.82, 50 SMA 133.01, 100 SMA @ 133.72 and 200 SMA @ 137.28.
| Trends | Trends.1 | |
|---|---|---|
| 0 | Daily SMA20 | 132.82 |
| 1 | Daily SMA50 | 133.01 |
| 2 | Daily SMA100 | 133.72 |
| 3 | Daily SMA200 | 137.28 |
The previous day high was 133.17 while the previous day low was 131.52. The daily 38.2% Fib levels comes at 132.15, expected to provide resistance. Similarly, the daily 61.8% fib level is at 132.54, expected to provide resistance.
Note the levels of interest below:
- Pivot support is noted at 131.09, 130.48, 129.45
- Pivot resistance is noted at 132.74, 133.78, 134.39
| Levels | Levels.1 |
|---|---|
| Previous Daily High | 133.17 |
| Previous Daily Low | 131.52 |
| Previous Weekly High | 133.60 |
| Previous Weekly Low | 130.41 |
| Previous Monthly High | 137.91 |
| Previous Monthly Low | 129.64 |
| Daily Fibonacci 38.2% | 132.15 |
| Daily Fibonacci 61.8% | 132.54 |
| Daily Pivot Point S1 | 131.09 |
| Daily Pivot Point S2 | 130.48 |
| Daily Pivot Point S3 | 129.45 |
| Daily Pivot Point R1 | 132.74 |
| Daily Pivot Point R2 | 133.78 |
| Daily Pivot Point R3 | 134.39 |
[/s2If]
Join Our Telegram Group
")


