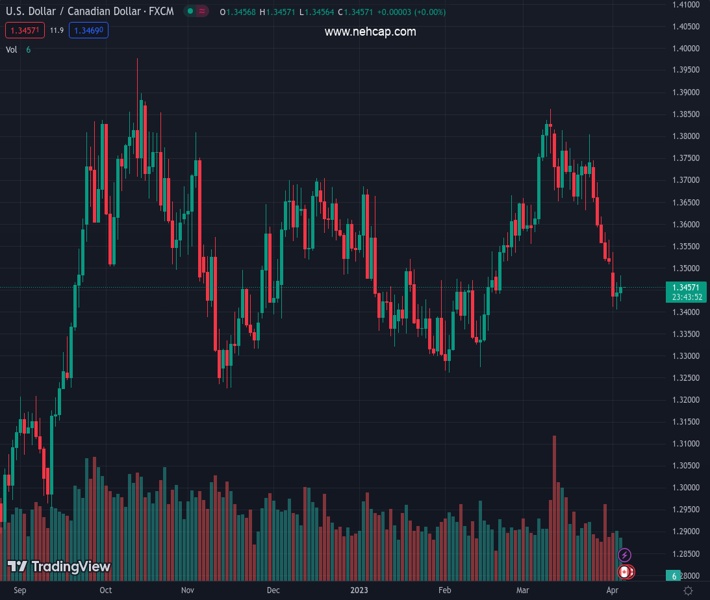
#USDCAD @ 1.34569 bulls come up for air ahead of US NFP. (Pivot Orderbook analysis)
…
This is a premium post.
[s2If !current_user_can(access_s2member_level4)]Please register for PREMIUM VERSION HERE to read full post below containing analysis. In case of any error or you think you are not able to read the full post below, please email us at support#nehcap.com [lwa][/s2If] [s2If current_user_can(access_s2member_level4)]
- USD/CAD bulls come up for air ahead of US NFP.
- The US Dollar is paring back shorts into the holidays.
The pair currently trades last at 1.34569.
The previous day high was 1.3467 while the previous day low was 1.3406. The daily 38.2% Fib levels comes at 1.3444, expected to provide support. Similarly, the daily 61.8% fib level is at 1.3429, expected to provide support.
USD/CAD is flat on Wednesday and had traveled between a low of 1.3423 and 1.3484 as the CAD consolidates this week´s gains as investors turned their attention to the release of US and Canadian employment data.
After touching its weakest intraday level since Feb. 16 at 1.3406, the pair rallied as investors pared back some of the short positions on profit-taking ahead of Friday´s showdown event. However, the US Dollar initially fell to mark a fresh bear cycle low on Wednesday but has since recovered the best part of the losses made on Tuesday´s sell-off and is now reaching back towards 102.00 DXY.
Meanwhile, a report today that showed US private sector employers added 145,000 jobs in March, well under expectations for a rise of 210,000 is casting a dark cloud over the Greenback. /The ADP National Employment report showed US private employers hired fewer workers than expected in March, suggesting a cooling labor market. Private employment increased by 145,000 jobs last month, while economists polled by Reuters had forecast private employment increasing by 200,000. In other data, the United States services industry was also shown to have slowed more than expected in March as the measure of prices paid by services businesses fell to the lowest in nearly three years. The ISM’s Non-Manufacturing index dropped to 51.2 in March from 55.1 in February. The services sector’s employment indicator sliding as well to 45.8 from 47.6 in February.
For Canada, data on Wednesday showed that Canada posted a smaller-than-expected trade surplus of C$422 million ($313 million) in February, as both exports and imports recorded widespread declines. Meanwhile, the price of oil , one of Canada’s major exports, was under pressure with WTI down some 0.8% into the close but off the lowest point of the day down at $79.77bbls. Oil has been weighed by worsening economic prospects against expectations of US crude inventory declines and plans by OPEC+ producers to reduce output.
Looking ahead, Canada’s employment report for March is due on Thursday. This is expected to show the economy added 12,000 jobs. This data falls ahead of Friday´s US Nonfarm Payrolls report whereby traders who are in on Good Friday will be looking for any confirmation that the labor market is cooling, a major requisite in the Federal Reserve’s fight to curb inflation. Particular attention will be paid to the Unemployment Rate in this regard.
Analysts at Brown Brothers Harriman said the following with regard to the forthcoming jobs data:
´´The consensus for Nonfarm Payrolls this Friday stands at 240k vs. 311k in February, while the unemployment rate is seen steady at 3.6%. Average hourly earnings are expected to slow to 4.3% y/y vs. 4.6% in February. It’s worth noting that the data will come on Good Friday. With markets likely to be very thin, we could get some outsize movements from the numbers, whether good or bad. ´´
Technical Levels: Supports and Resistances
USDCAD currently trading at 1.3457 at the time of writing. Pair opened at 1.3445 and is trading with a change of 0.09 % .
| Overview | Overview.1 | |
|---|---|---|
| 0 | Today last price | 1.3457 |
| 1 | Today Daily Change | 0.0012 |
| 2 | Today Daily Change % | 0.0900 |
| 3 | Today daily open | 1.3445 |
The pair is trading below its 20 Daily moving average @ 1.367, below its 50 Daily moving average @ 1.3546 , below its 100 Daily moving average @ 1.3524 and above its 200 Daily moving average @ 1.3381
| Trends | Trends.1 | |
|---|---|---|
| 0 | Daily SMA20 | 1.3670 |
| 1 | Daily SMA50 | 1.3546 |
| 2 | Daily SMA100 | 1.3524 |
| 3 | Daily SMA200 | 1.3381 |
The previous day high was 1.3467 while the previous day low was 1.3406. The daily 38.2% Fib levels comes at 1.3444, expected to provide support. Similarly, the daily 61.8% fib level is at 1.3429, expected to provide support.
Note the levels of interest below:
- Pivot support is noted at 1.3411, 1.3378, 1.335
- Pivot resistance is noted at 1.3473, 1.3501, 1.3535
| Levels | Levels.1 |
|---|---|
| Previous Daily High | 1.3467 |
| Previous Daily Low | 1.3406 |
| Previous Weekly High | 1.3745 |
| Previous Weekly Low | 1.3508 |
| Previous Monthly High | 1.3862 |
| Previous Monthly Low | 1.3508 |
| Daily Fibonacci 38.2% | 1.3444 |
| Daily Fibonacci 61.8% | 1.3429 |
| Daily Pivot Point S1 | 1.3411 |
| Daily Pivot Point S2 | 1.3378 |
| Daily Pivot Point S3 | 1.3350 |
| Daily Pivot Point R1 | 1.3473 |
| Daily Pivot Point R2 | 1.3501 |
| Daily Pivot Point R3 | 1.3535 |
[/s2If]
Join Our Telegram Group
")


