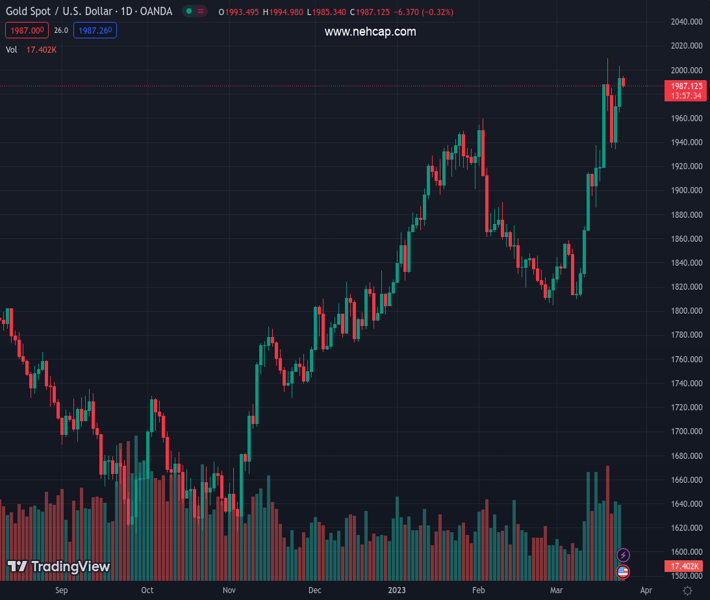
#XAUUSD @ 1,986.59 Gold price remains mildly offered while snapping two-day uptrend., @nehcap view: Pullback expected (Pivot Orderbook analysis)
…
This is a premium post.
[s2If !current_user_can(access_s2member_level4)]Please register for PREMIUM VERSION HERE to read full post below containing analysis. In case of any error or you think you are not able to read the full post below, please email us at support#nehcap.com [lwa][/s2If] [s2If current_user_can(access_s2member_level4)]
- Gold price remains mildly offered while snapping two-day uptrend.
- Sluggish markets allow XAU/USD bulls to take a breather ahead the key US data.
- Fed concerns, banking turmoil keeps Gold buyers hopeful.
- XAU/USD bulls need downbeat US PMI, Durable Goods Orders to cross $2,015 key hurdle.
The pair currently trades last at 1986.59.
The previous day high was 2003.37 while the previous day low was 1964.64. The daily 38.2% Fib levels comes at 1988.58, expected to provide resistance. Similarly, the daily 61.8% fib level is at 1979.43, expected to provide support.
Gold price (XAU/USD) renews its intraday low around $1,987 during the first loss-making day in three amid early Friday morning in Europe. In doing so, the XAU/USD traces downbeat US Treasury bond yields amid a sluggish end of an active week.
That said, the dovish concerns surrounding the Federal Reserve’s (Fed) next move, as well as the downbeat yields, challenge the Gold price traders even as banking fears join hopes of upbeat data and market consolidation to weigh on XAU/USD prices of late.
Fed’s heavy lending amid the banking rout flags fears of a ballooning Fed balance sheet, which in turn renews hawkish calls for the US central bank’s next moves and lures the Gold bears near the multi-day high.
However, the mixed US data and the latest Fed statement appear to challenge the policy hawks. Also challenging the US Dollar could be the comments from key market players like DoubleLine’s Gundlach who recently reiterated his dovish bias for the US central banks.
Elsewhere, comments from US Treasury Secretary Janet Yellen and the Chair of the Basel Committee on Banking Supervision, portraying the market’s fears of banking fallouts, also weigh on the market’s mood and challenge the XAU/USD buyers. However, the recent retreat in the market’s consolidation allows the Gold buyers to consolidate recent gains ahead of the key data/events.
While portraying the mood, US 10-year and two-year Treasury bond yields remain depressed at around 3.38% and 3.78% respectively by the press time whereas the S&P 500 Futures struggle to copy Wall Street’s positive moves.
Among the important US data are the first readings of the US S&P Global PMIs for March and Durable Goods Orders for February.
Also read: S&P Global PMIs Preview: EU and US figures to shed light on economic progress
Gold price fades bounce off one-week-old horizontal support as the previous support line from early March pushes back XAU/USD bulls amid the RSI retreat.
However, the bullish MACD signals and the precious metal’s hesitance in welcoming bears, as shown by the 100-SMA successful ride above the 200-SMA, keep the Gold buyers hopeful.
That said, the previous monthly high near $1,960 acts as immediate support for the XAU/USD bears to watch during the quote’s further weakness ahead of the aforementioned horizontal level surrounding $1,935.
Following that, the Gold sellers can aim for the last defenses of buyers, namely 100-SMA and 200-SMA, respectively near $1,898 and $1,869 by the press time.
Alternatively, the $2,000 round figure may act as an immediate upside hurdle for the Gold price.
Though, a convergence of an upward-sloping trend line from January 26 and a two-week-old previous support line, around $2,015, appears a tough nut to crack for the Gold buyers.
Should the quote rises past $2,015, the odds of witnessing a rally towards the previous yearly top surrounding $2,070 can’t be ruled out.
Trend: Pullback expected
Technical Levels: Supports and Resistances
XAUUSD currently trading at 1987.12 at the time of writing. Pair opened at 1993.19 and is trading with a change of -0.30% % .
| Overview | Overview.1 | |
|---|---|---|
| 0 | Today last price | 1987.12 |
| 1 | Today Daily Change | -6.07 |
| 2 | Today Daily Change % | -0.30% |
| 3 | Today daily open | 1993.19 |
The pair remains strongly bullish on the daily timeframe. It trades above its 20 SMA @ 1884.34, 50 SMA 1886.8, 100 SMA @ 1837.52 and 200 SMA @ 1779.78.
| Trends | Trends.1 | |
|---|---|---|
| 0 | Daily SMA20 | 1884.34 |
| 1 | Daily SMA50 | 1886.80 |
| 2 | Daily SMA100 | 1837.52 |
| 3 | Daily SMA200 | 1779.78 |
The previous day high was 2003.37 while the previous day low was 1964.64. The daily 38.2% Fib levels comes at 1988.58, expected to provide resistance. Similarly, the daily 61.8% fib level is at 1979.43, expected to provide support.
Note the levels of interest below:
- Pivot support is noted at 1970.76, 1948.34, 1932.03
- Pivot resistance is noted at 2009.49, 2025.8, 2048.22
| Levels | Levels.1 |
|---|---|
| Previous Daily High | 2003.37 |
| Previous Daily Low | 1964.64 |
| Previous Weekly High | 1989.51 |
| Previous Weekly Low | 1867.66 |
| Previous Monthly High | 1959.80 |
| Previous Monthly Low | 1804.76 |
| Daily Fibonacci 38.2% | 1988.58 |
| Daily Fibonacci 61.8% | 1979.43 |
| Daily Pivot Point S1 | 1970.76 |
| Daily Pivot Point S2 | 1948.34 |
| Daily Pivot Point S3 | 1932.03 |
| Daily Pivot Point R1 | 2009.49 |
| Daily Pivot Point R2 | 2025.80 |
| Daily Pivot Point R3 | 2048.22 |
[/s2If]
Join Our Telegram Group
")


