#XAGUSD @ 23.059 Silver prices retreats from seven-week high, portrays a bearish chart formation., @nehcap view: Further downside expected (Pivot Orderbook analysis)
…
This is a premium post.
[s2If !current_user_can(access_s2member_level4)]Please register for PREMIUM VERSION HERE to read full post below containing analysis. In case of any error or you think you are not able to read the full post below, please email us at support#nehcap.com [lwa][/s2If] [s2If current_user_can(access_s2member_level4)]
- Silver prices retreats from seven-week high, portrays a bearish chart formation.
- Overbought RSI, sluggish MACD signals add strength to downside bias.
- Key SMAs can test the XAG/USD sellers; bulls need validation from $23.60.
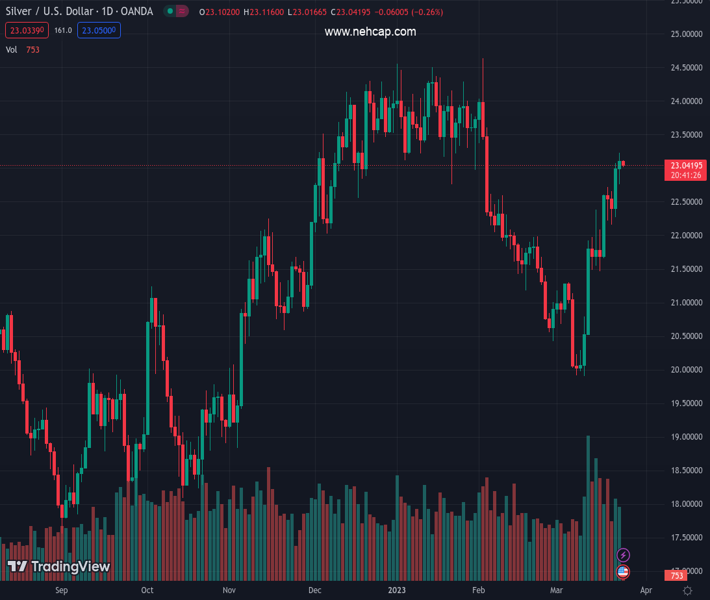
The pair currently trades last at 23.059.
The previous day high was 23.07 while the previous day low was 22.27. The daily 38.2% Fib levels comes at 22.77, expected to provide support. Similarly, the daily 61.8% fib level is at 22.58, expected to provide support.
Silver price (XAG/USD) drops to $23.00 as it snaps a two-day winning streak while reversing from the highest levels since early February on Friday. In doing so, the bright metal prints a one-week-old rising wedge bearish chart formation and lures the sellers due to the pattern’s positioning at the multi-day top.
Adding strength to the downside bias could be the sluggish MACD signals and the overbought conditions of the RSI (14) line.
As a result, the XAG/USD is likely to decline further toward the 61.8% Fibonacci retracement level of the metal’s fall during the February-March period, around $22.80.
However, the quote’s further declines hinge on its ability to break the stated wedge’s lower line, around $22.60 at the latest.
Following that, the 50-SMA and 200-SMA can entertain the XAG/USD sellers around $22.30 and $21.55 during the theoretical south-run towards the early March swing high surrounding $21.30.
Alternatively, recovery moves need to cross the $23.20 hurdle to defy the bearish chart formation.
Even so, multiple hurdles marked around $23.60 can prod the Silver buyers before directing them to the previous monthly high surrounding $24.65.
Overall, Silver price is likely to witness a pullback but the road towards the south appears limited.
Trend: Further downside expected
Technical Levels: Supports and Resistances
XAGUSD currently trading at 23.05 at the time of writing. Pair opened at 22.97 and is trading with a change of 0.35% % .
| Overview | Overview.1 | |
|---|---|---|
| 0 | Today last price | 23.05 |
| 1 | Today Daily Change | 0.08 |
| 2 | Today Daily Change % | 0.35% |
| 3 | Today daily open | 22.97 |
The pair remains strongly bullish on the daily timeframe. It trades above its 20 SMA @ 21.3, 50 SMA 22.28, 100 SMA @ 22.42 and 200 SMA @ 20.96.
| Trends | Trends.1 | |
|---|---|---|
| 0 | Daily SMA20 | 21.30 |
| 1 | Daily SMA50 | 22.28 |
| 2 | Daily SMA100 | 22.42 |
| 3 | Daily SMA200 | 20.96 |
The previous day high was 23.07 while the previous day low was 22.27. The daily 38.2% Fib levels comes at 22.77, expected to provide support. Similarly, the daily 61.8% fib level is at 22.58, expected to provide support.
Note the levels of interest below:
- Pivot support is noted at 22.47, 21.97, 21.67
- Pivot resistance is noted at 23.27, 23.57, 24.07
| Levels | Levels.1 |
|---|---|
| Previous Daily High | 23.07 |
| Previous Daily Low | 22.27 |
| Previous Weekly High | 22.61 |
| Previous Weekly Low | 20.54 |
| Previous Monthly High | 24.64 |
| Previous Monthly Low | 20.42 |
| Daily Fibonacci 38.2% | 22.77 |
| Daily Fibonacci 61.8% | 22.58 |
| Daily Pivot Point S1 | 22.47 |
| Daily Pivot Point S2 | 21.97 |
| Daily Pivot Point S3 | 21.67 |
| Daily Pivot Point R1 | 23.27 |
| Daily Pivot Point R2 | 23.57 |
| Daily Pivot Point R3 | 24.07 |
[/s2If]
Join Our Telegram Group
")


