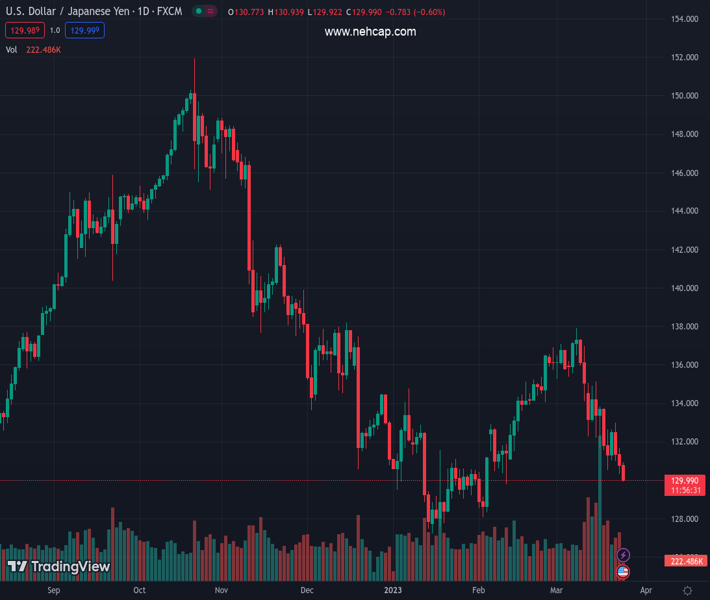
#USDJPY @ 130.037 remains under heavy selling pressure for the third straight day on Friday. (Pivot Orderbook analysis)
…
This is a premium post.
[s2If !current_user_can(access_s2member_level4)]Please register for PREMIUM VERSION HERE to read full post below containing analysis. In case of any error or you think you are not able to read the full post below, please email us at support#nehcap.com [lwa][/s2If] [s2If current_user_can(access_s2member_level4)]
- USD/JPY remains under heavy selling pressure for the third straight day on Friday.
- Expectations for a hawkish shift by the BoJ boost the JPY and drag the pair lower.
- Some follow-through USD buying could lend support and help limit further losses.
The pair currently trades last at 130.037.
The previous day high was 131.66 while the previous day low was 130.32. The daily 38.2% Fib levels comes at 130.83, expected to provide resistance. Similarly, the daily 61.8% fib level is at 131.15, expected to provide resistance.
The USD/JPY pair extends this week’s rejection slide from the 133.00 mark and continues drifting lower for the third successive day on Friday. Spot prices drop to the lowest level since February 10 during the first half of the European session, with bears now looking to extend the downward trajectory further below the 130.00 psychological mark.
The Japanese Yen (JPY) strengthens across the board in reaction to the domestic data, showing that an important gauge of Japan’s consumer prices rose at its fastest pace since 1982 in February. In fact, Japan’s core-core CPI, which strips out energy and food prices but includes alcoholic beverages, accelerated to 3.5% in February – marking the fastest year-on-year increase in 41 years. This boosts expectations that the Bank of Japan (BoJ) will tweak its bond yield control policy in the near term, which, in turn, benefits the domestic currency and continues to exert downward pressure on the USD/JPY pair.
Bearish traders further take cues from a further decline in the US Treasury bond yields, led by the Federal Reserve’s signal that it might soon pause the rate-hiking cycle in the wake of the recent turmoil in the banking sector. In fact, the yield on the benchmark 10-year US government bond and the rate-sensitive two-year Treasury note languish near a six-month low touched earlier this week. This results in a further narrowing of the US-Japan rate differential, which is seen as another factor that drives flows towards the JPY and contributes to the heavily offered tone surrounding the USD/JPY pair.
The US Dollar (USD), on the other hand, is gaining some follow-through traction for the second successive day and building on the overnight goodish rebound from a seven-week low. This, in turn, is holding back bearish traders from placing fresh bets around the USD/JPY pair and helping limit the downside, at least for the time being. Nevertheless, spot prices remain on track to register losses for the fourth straight week and the aforementioned fundamental backdrop supports prospects for an extension of the recent rejection slide from the 200-day Simple Moving Average (SMA).
Market participants now look forward to the US economic docket, featuring the release of the Durable Goods Orders data and the flash PMI prints for March later during the early North American session. This, along with the US bond yields, might influence the USD price dynamics and provide some impetus to the USD/JPY pair. Traders will further take cues from the broader risk sentiment to grab short-term opportunities on the last day of the week.
Technical Levels: Supports and Resistances
USDJPY currently trading at 130.23 at the time of writing. Pair opened at 130.83 and is trading with a change of -0.46 % .
| Overview | Overview.1 | |
|---|---|---|
| 0 | Today last price | 130.23 |
| 1 | Today Daily Change | -0.60 |
| 2 | Today Daily Change % | -0.46 |
| 3 | Today daily open | 130.83 |
The pair remains strongly bearish on the daily time frame. It trades below the 20 SMA @ 134.57, 50 SMA 132.55, 100 SMA @ 134.61 and 200 SMA @ 137.43.
| Trends | Trends.1 | |
|---|---|---|
| 0 | Daily SMA20 | 134.57 |
| 1 | Daily SMA50 | 132.55 |
| 2 | Daily SMA100 | 134.61 |
| 3 | Daily SMA200 | 137.43 |
The previous day high was 131.66 while the previous day low was 130.32. The daily 38.2% Fib levels comes at 130.83, expected to provide resistance. Similarly, the daily 61.8% fib level is at 131.15, expected to provide resistance.
Note the levels of interest below:
- Pivot support is noted at 130.21, 129.6, 128.87
- Pivot resistance is noted at 131.55, 132.28, 132.89
| Levels | Levels.1 |
|---|---|
| Previous Daily High | 131.66 |
| Previous Daily Low | 130.32 |
| Previous Weekly High | 135.12 |
| Previous Weekly Low | 131.56 |
| Previous Monthly High | 136.92 |
| Previous Monthly Low | 128.08 |
| Daily Fibonacci 38.2% | 130.83 |
| Daily Fibonacci 61.8% | 131.15 |
| Daily Pivot Point S1 | 130.21 |
| Daily Pivot Point S2 | 129.60 |
| Daily Pivot Point S3 | 128.87 |
| Daily Pivot Point R1 | 131.55 |
| Daily Pivot Point R2 | 132.28 |
| Daily Pivot Point R3 | 132.89 |
[/s2If]
Join Our Telegram Group
")


