#USDINR @ 82.2150 is oscillating in a 10-pip range as investors await US Durable Goods Orders and preliminary PMI data. (Pivot Orderbook analysis)
…
This is a premium post.
[s2If !current_user_can(access_s2member_level4)]Please register for PREMIUM VERSION HERE to read full post below containing analysis. In case of any error or you think you are not able to read the full post below, please email us at support#nehcap.com [lwa][/s2If] [s2If current_user_can(access_s2member_level4)]
- USD/INR is oscillating in a 10-pip range as investors await US Durable Goods Orders and preliminary PMI data.
- Lack of follow-up buying in the S&P500 futures after a confident recovery move has stemmed clouds of uncertainty.
- The Indian government has started assessing the performance of state-run lenders and PSUs after the global banking debacle.
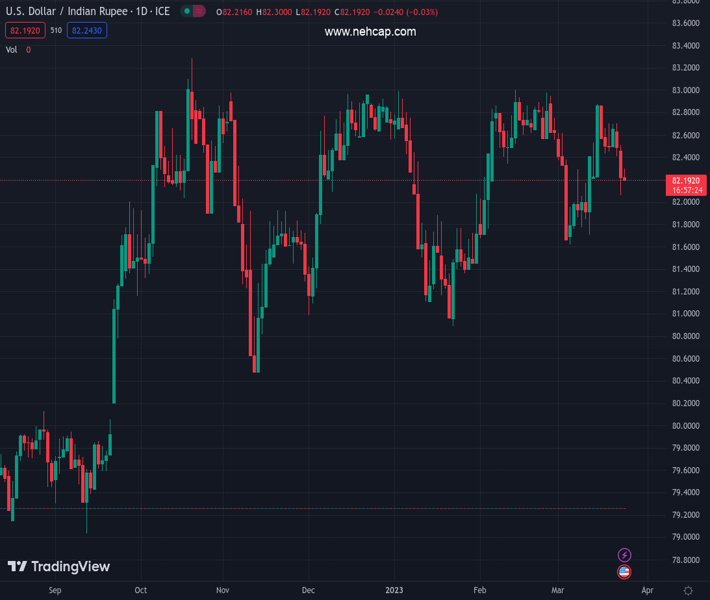
The pair currently trades last at 82.2150.
The previous day high was 82.7295 while the previous day low was 82.0371. The daily 38.2% Fib levels comes at 82.3016, expected to provide resistance. Similarly, the daily 61.8% fib level is at 82.465, expected to provide resistance.
The USD/INR pair is displaying topsy-turvy moves in a narrow range of 82.20-82.30 in the Asian session. The asset has a positive opening on Friday as the US Dollar Index (DXY) rebounded firmly after dropping to near 102.00 in Thursday’s session. The USD Index has extended its recovery to near 102.68 as other central banks are also saying no to further rate hikes and are looking to assess the impact of current monetary policy.
S&P500 futures are showing choppy moves in the Asian session. The lack of follow-up buying in the 500-US stocks basket futures after a confident recovery move on Thursday has stemmed clouds of uncertainty. Two-year US Treasury yields that closely follow the US equities benchmark look vulnerable above 3.8%.
Going forward, the release of the United States Durable Goods Orders (Feb) data will be a key trigger for the mighty USD Index. As per the consensus, the economic data will expand by 0.6% against a contraction of 4.5% released earlier. The economic indicator shows forward demand for Durable Goods and an increment in the same could renew fears of policy-tightening by the Federal Reserve (Fed).
Apart from that, preliminary US S&P Global PMI (March) data will be keenly watched. The Manufacturing PMI is expected to trim to 47.0 from the former release of 47.3. And, Service PMI might soften to 50.5 from the prior release of 50.6.
On the Indian Rupee front, Prime Minister Modi-led-government has initiated finding out any signs of banking shakedown after escalating global banking fiasco. Finance Minister Nirmala Sitharaman has ordered for the assessment of state-run lenders and public sector banks (PSUs) about their performance and assessment of capital requirements.
Technical Levels: Supports and Resistances
USDINR currently trading at 82.2868 at the time of writing. Pair opened at 82.23 and is trading with a change of 0.07 % .
| Overview | Overview.1 | |
|---|---|---|
| 0 | Today last price | 82.2868 |
| 1 | Today Daily Change | 0.0568 |
| 2 | Today Daily Change % | 0.0700 |
| 3 | Today daily open | 82.2300 |
The pair is trading below its 20 Daily moving average @ 82.3562, above its 50 Daily moving average @ 82.209 , above its 100 Daily moving average @ 82.1198 and above its 200 Daily moving average @ 81.1951
| Trends | Trends.1 | |
|---|---|---|
| 0 | Daily SMA20 | 82.3562 |
| 1 | Daily SMA50 | 82.2090 |
| 2 | Daily SMA100 | 82.1198 |
| 3 | Daily SMA200 | 81.1951 |
The previous day high was 82.7295 while the previous day low was 82.0371. The daily 38.2% Fib levels comes at 82.3016, expected to provide resistance. Similarly, the daily 61.8% fib level is at 82.465, expected to provide resistance.
Note the levels of interest below:
- Pivot support is noted at 81.9349, 81.6398, 81.2425
- Pivot resistance is noted at 82.6273, 83.0246, 83.3197
| Levels | Levels.1 |
|---|---|
| Previous Daily High | 82.7295 |
| Previous Daily Low | 82.0371 |
| Previous Weekly High | 83.0315 |
| Previous Weekly Low | 81.5120 |
| Previous Monthly High | 83.0820 |
| Previous Monthly Low | 81.5032 |
| Daily Fibonacci 38.2% | 82.3016 |
| Daily Fibonacci 61.8% | 82.4650 |
| Daily Pivot Point S1 | 81.9349 |
| Daily Pivot Point S2 | 81.6398 |
| Daily Pivot Point S3 | 81.2425 |
| Daily Pivot Point R1 | 82.6273 |
| Daily Pivot Point R2 | 83.0246 |
| Daily Pivot Point R3 | 83.3197 |
[/s2If]
Join Our Telegram Group
")


