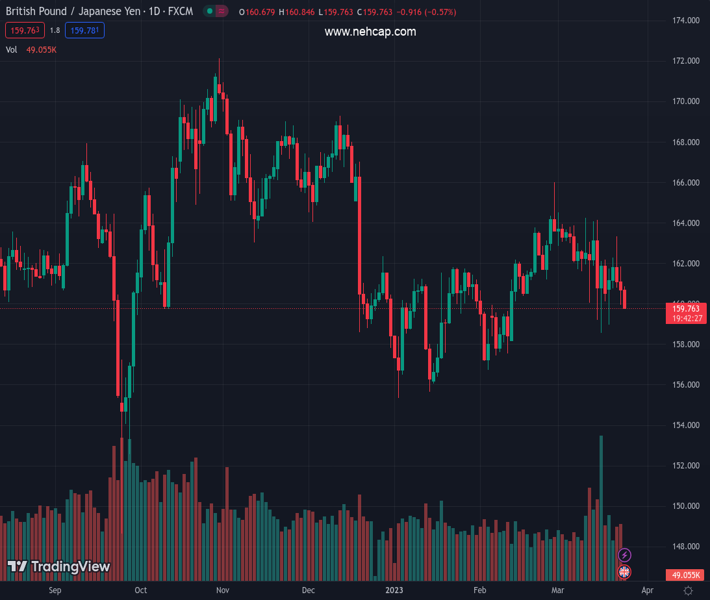
#GBPJPY @ 159.870 prints three-day downtrend on breaking one-week-old ascending trend line., @nehcap view: Further downside expected (Pivot Orderbook analysis)
…
This is a premium post.
[s2If !current_user_can(access_s2member_level4)]Please register for PREMIUM VERSION HERE to read full post below containing analysis. In case of any error or you think you are not able to read the full post below, please email us at support#nehcap.com [lwa][/s2If] [s2If current_user_can(access_s2member_level4)]
- GBP/JPY prints three-day downtrend on breaking one-week-old ascending trend line.
- Clear U-turn from the key EMA confluence, downbeat oscillators favor sellers.
- Bears approach 10-week-old upward-sloping support line but further downside appears elusive.
The pair currently trades last at 159.870.
The previous day high was 161.86 while the previous day low was 159.94. The daily 38.2% Fib levels comes at 160.68, expected to provide resistance. Similarly, the daily 61.8% fib level is at 161.13, expected to provide resistance.
GBP/JPY takes offers to refresh the intraday low near 160.30 during early Friday, extending the previous two-day fall towards short-term key support.
In doing so, the cross-currency pair justifies the previous day’s downside break of a one-week-old support line, now immediate resistance near 161.25. Adding strength to the bearish bias is the quote’s reversal from a convergence of the 100-bar Exponential Moving Average (EMA) and the 200-EMA, around 161.70-80 at the latest.
It’s worth mentioning that the bearish MACD signals and an absence of oversold RSI (14) also keep the GBP/JPY sellers hopeful of witnessing the pair’s further downside.
As a result, an ascending support line from January 13, close to 159.20 by the press time, gains the major attention of the pair bears.
Following that, the monthly low of 159.56 may act as a validation point for the GBP/JPY pair’s slump toward the February low of 156.73.
On the contrary, an upside break of the support-turned-resistance line of around 161.25 will need validation from the aforementioned EMA confluence of 161.70-80 to recall the GBP/JPY buyers.
Even so, a one-month-long descending resistance line surrounding 163.00 appears crucial for the bulls to cross to retake control.
Trend: Further downside expected
Technical Levels: Supports and Resistances
GBPJPY currently trading at 160.31 at the time of writing. Pair opened at 160.76 and is trading with a change of -0.28% % .
| Overview | Overview.1 | |
|---|---|---|
| 0 | Today last price | 160.31 |
| 1 | Today Daily Change | -0.45 |
| 2 | Today Daily Change % | -0.28% |
| 3 | Today daily open | 160.76 |
The pair remains strongly bearish on the daily time frame. It trades below the 20 SMA @ 162.41, 50 SMA 160.98, 100 SMA @ 162.6 and 200 SMA @ 163.28.
| Trends | Trends.1 | |
|---|---|---|
| 0 | Daily SMA20 | 162.41 |
| 1 | Daily SMA50 | 160.98 |
| 2 | Daily SMA100 | 162.60 |
| 3 | Daily SMA200 | 163.28 |
The previous day high was 161.86 while the previous day low was 159.94. The daily 38.2% Fib levels comes at 160.68, expected to provide resistance. Similarly, the daily 61.8% fib level is at 161.13, expected to provide resistance.
Note the levels of interest below:
- Pivot support is noted at 159.85, 158.94, 157.93
- Pivot resistance is noted at 161.77, 162.77, 163.69
| Levels | Levels.1 |
|---|---|
| Previous Daily High | 161.86 |
| Previous Daily Low | 159.94 |
| Previous Weekly High | 164.14 |
| Previous Weekly Low | 158.57 |
| Previous Monthly High | 166.01 |
| Previous Monthly Low | 156.73 |
| Daily Fibonacci 38.2% | 160.68 |
| Daily Fibonacci 61.8% | 161.13 |
| Daily Pivot Point S1 | 159.85 |
| Daily Pivot Point S2 | 158.94 |
| Daily Pivot Point S3 | 157.93 |
| Daily Pivot Point R1 | 161.77 |
| Daily Pivot Point R2 | 162.77 |
| Daily Pivot Point R3 | 163.69 |
[/s2If]
Join Our Telegram Group
")


