#EURUSD @ 1.08332 stays defensive after reversing from seven-week high, as well as snapping five-day uptrend., @nehcap view: Further downside expected (Pivot Orderbook analysis)
…
This is a premium post.
[s2If !current_user_can(access_s2member_level4)]Please register for PREMIUM VERSION HERE to read full post below containing analysis. In case of any error or you think you are not able to read the full post below, please email us at support#nehcap.com [lwa][/s2If] [s2If current_user_can(access_s2member_level4)]
- EUR/USD stays defensive after reversing from seven-week high, as well as snapping five-day uptrend.
- Break of weekly support line, downbeat oscillators favor sellers even if 61.8% Fibonacci retracement prods immediate declines.
- Recovery moves need validation from 1.0935 to aim for fresh 2023 high.
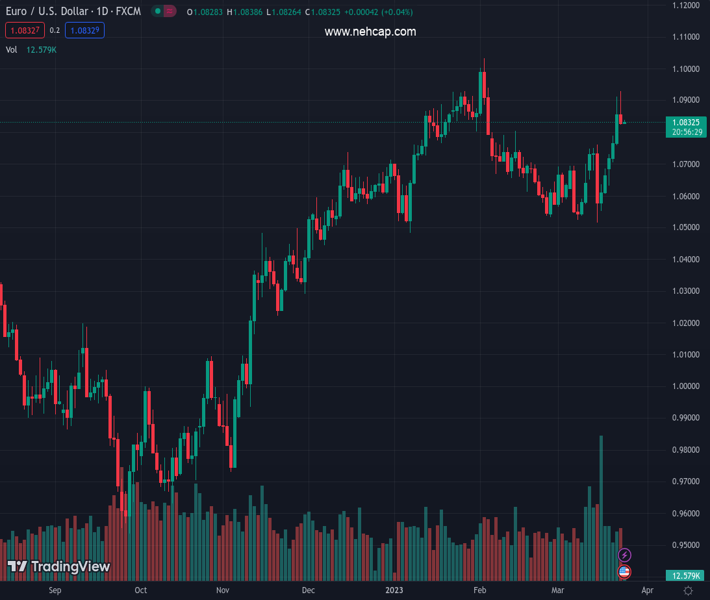
The pair currently trades last at 1.08332.
The previous day high was 1.0912 while the previous day low was 1.0759. The daily 38.2% Fib levels comes at 1.0854, expected to provide resistance. Similarly, the daily 61.8% fib level is at 1.0818, expected to provide support.
EUR/USD seesaws around 1.0830-20 as the key Fibonacci retracement level probes bears during early Friday, following the Euro pair’s U-turn from a seven-week high the previous day.
EUR/USD marked the first daily loss in six on Thursday as it failed to cross the two-month-old horizontal resistance area surrounding 1.0930-35. The following pullback also broke an upward-sloping support line from Monday and allowed intraday sellers to tighten the grip.
It should be noted that the RSI’s U-turn from the overbought territory breaks short-term support and the MACD also teases bears, which in turn suggests the EUR/USD pair’s further downside even if the 61.8% Fibonacci retracement of February-March fall prods sellers of late.
That said, an upward-sloping support line from March 15 joins the mid-month high to keep the EUR/USD bear’s focus on the 1.0765-60 support zone.
If the pair manages to break the same, it could quickly drop to a convergence of the 100-SMA and 200-SMA, around 1.0670-65.
Alternatively, the EUR/USD pair’s recovery moves may initially aim for the support-turned-resistance line stretched from Monday, near 1.0885 at the latest.
However, bulls should remain cautious unless witnessing a clear break of 1.0935. Following that, a run-up towards refreshing the yearly high, around 1.1035 at the latest, can’t be ruled out.
Trend: Further downside expected
Technical Levels: Supports and Resistances
EURUSD currently trading at 1.0832 at the time of writing. Pair opened at 1.0856 and is trading with a change of -0.22% % .
| Overview | Overview.1 | |
|---|---|---|
| 0 | Today last price | 1.0832 |
| 1 | Today Daily Change | -0.0024 |
| 2 | Today Daily Change % | -0.22% |
| 3 | Today daily open | 1.0856 |
The pair remains strongly bullish on the daily timeframe. It trades above its 20 SMA @ 1.0644, 50 SMA 1.0731, 100 SMA @ 1.0597 and 200 SMA @ 1.0331.
| Trends | Trends.1 | |
|---|---|---|
| 0 | Daily SMA20 | 1.0644 |
| 1 | Daily SMA50 | 1.0731 |
| 2 | Daily SMA100 | 1.0597 |
| 3 | Daily SMA200 | 1.0331 |
The previous day high was 1.0912 while the previous day low was 1.0759. The daily 38.2% Fib levels comes at 1.0854, expected to provide resistance. Similarly, the daily 61.8% fib level is at 1.0818, expected to provide support.
Note the levels of interest below:
- Pivot support is noted at 1.0772, 1.0689, 1.0619
- Pivot resistance is noted at 1.0926, 1.0996, 1.1079
| Levels | Levels.1 |
|---|---|
| Previous Daily High | 1.0912 |
| Previous Daily Low | 1.0759 |
| Previous Weekly High | 1.0760 |
| Previous Weekly Low | 1.0516 |
| Previous Monthly High | 1.1033 |
| Previous Monthly Low | 1.0533 |
| Daily Fibonacci 38.2% | 1.0854 |
| Daily Fibonacci 61.8% | 1.0818 |
| Daily Pivot Point S1 | 1.0772 |
| Daily Pivot Point S2 | 1.0689 |
| Daily Pivot Point S3 | 1.0619 |
| Daily Pivot Point R1 | 1.0926 |
| Daily Pivot Point R2 | 1.0996 |
| Daily Pivot Point R3 | 1.1079 |
[/s2If]
Join Our Telegram Group
")


