#EURUSD @ 1.08220 is declining towards 1.0800 as USD Index has extended its recovery further. (Pivot Orderbook analysis)
…
This is a premium post.
[s2If !current_user_can(access_s2member_level4)]Please register for PREMIUM VERSION HERE to read full post below containing analysis. In case of any error or you think you are not able to read the full post below, please email us at support#nehcap.com [lwa][/s2If] [s2If current_user_can(access_s2member_level4)]
- EUR/USD is declining towards 1.0800 as USD Index has extended its recovery further.
- S&P500 futures recovered after the promise of insurance on additional deposits by US Treasury Secretary Yellen.
- Going forward, the release of the preliminary S&P Global Eurozone/US PMIs (March) will be keenly watched.
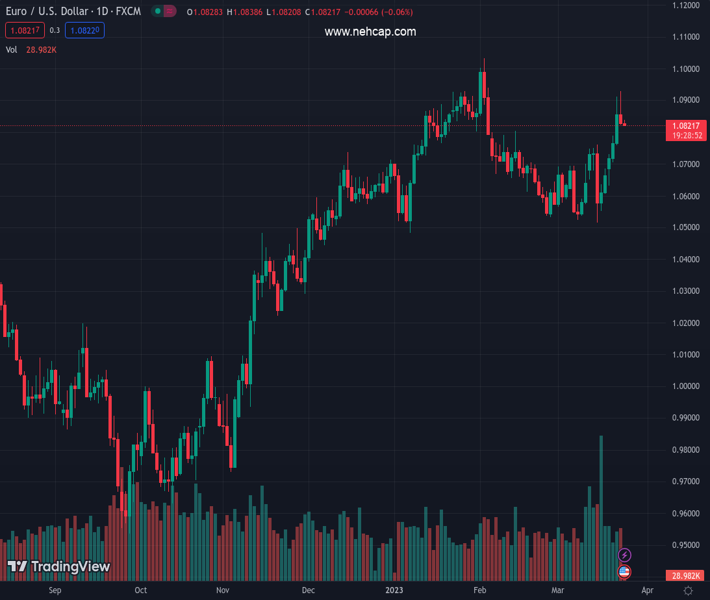
The pair currently trades last at 1.08220.
The previous day high was 1.093 while the previous day low was 1.0824. The daily 38.2% Fib levels comes at 1.0865, expected to provide resistance. Similarly, the daily 61.8% fib level is at 1.0889, expected to provide resistance.
The EUR/USD pair is displaying a back-and-forth action around 1.0830 in the Tokyo session. The major currency pair is expected to continue its downside momentum toward the round-level support of 1.0800. The downside bias for shared currency pair is strengthening as the US Dollar Index (DXY) has shown a significant recovery.
S&P500 futures remain silent after a recovery move on Thursday backed by the promise of insurance on additional deposits by US Treasury Secretary Janet Yellen, which restored the confidence of investors, portraying some optimism in US equities. The US Dollar Index (DXY) has extended its recovery to near 102.70 as other western central banks are also following the footprints of the Federal Reserve (Fed).
On Wednesday, at the monetary policy meeting, Fed chair Jerome Powell delivered signs of concluding the year-long rate hiking spree to avoid any further mess in the banking crisis. Also, rates have reached to a point where room for further escalation is less. Like the Fed, other central banks are also eyeing a pause in the rate-hiking cycle such as the Bank of England (BoE), and the Reserve Bank of Australia (RBA). Therefore, the USD Index has shown a recovery move due to its safe-haven appeal.
Meanwhile, the demand for US government bonds has extended further as investors have cheered that the Fed is pausing rate hikes sooner. Higher demand for US bonds has trimmed the return offered on 10-year US Treasury yields below 3.4%.
Going forward, the release of the preliminary S&P Global Eurozone/US PMIs (March) will be keenly watched. Mixed performance is expected from both economies.
On the Eurozone front, unlike other economies, bigger rate hikes are still preferred as the European Central Bank (ECB) has still more room left. Also, the core inflation is extremely stubborn due to high wage pressures. ECB policymaker Klaas Knot said that the ECB is unlikely to be done with rate hikes and added that they still think that they need to raise the policy rate in May.
Technical Levels: Supports and Resistances
EURUSD currently trading at 1.0823 at the time of writing. Pair opened at 1.0831 and is trading with a change of -0.07 % .
| Overview | Overview.1 | |
|---|---|---|
| 0 | Today last price | 1.0823 |
| 1 | Today Daily Change | -0.0008 |
| 2 | Today Daily Change % | -0.0700 |
| 3 | Today daily open | 1.0831 |
The pair remains strongly bullish on the daily timeframe. It trades above its 20 SMA @ 1.0656, 50 SMA 1.073, 100 SMA @ 1.0607 and 200 SMA @ 1.0333.
| Trends | Trends.1 | |
|---|---|---|
| 0 | Daily SMA20 | 1.0656 |
| 1 | Daily SMA50 | 1.0730 |
| 2 | Daily SMA100 | 1.0607 |
| 3 | Daily SMA200 | 1.0333 |
The previous day high was 1.093 while the previous day low was 1.0824. The daily 38.2% Fib levels comes at 1.0865, expected to provide resistance. Similarly, the daily 61.8% fib level is at 1.0889, expected to provide resistance.
Note the levels of interest below:
- Pivot support is noted at 1.0794, 1.0756, 1.0688
- Pivot resistance is noted at 1.0899, 1.0967, 1.1005
| Levels | Levels.1 |
|---|---|
| Previous Daily High | 1.0930 |
| Previous Daily Low | 1.0824 |
| Previous Weekly High | 1.0760 |
| Previous Weekly Low | 1.0516 |
| Previous Monthly High | 1.1033 |
| Previous Monthly Low | 1.0533 |
| Daily Fibonacci 38.2% | 1.0865 |
| Daily Fibonacci 61.8% | 1.0889 |
| Daily Pivot Point S1 | 1.0794 |
| Daily Pivot Point S2 | 1.0756 |
| Daily Pivot Point S3 | 1.0688 |
| Daily Pivot Point R1 | 1.0899 |
| Daily Pivot Point R2 | 1.0967 |
| Daily Pivot Point R3 | 1.1005 |
[/s2If]
Join Our Telegram Group
")


