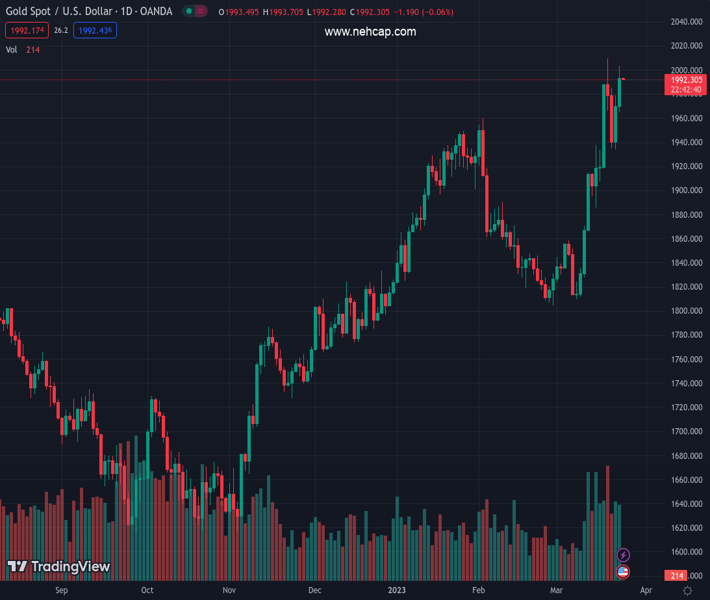
#XAUUSD @ 1,992.61 Gold price is looking to shift its auction above $2,000.00 as the Fed doesn’t believe more rate hikes are appropriate. (Pivot Orderbook analysis)
…
This is a premium post.
[s2If !current_user_can(access_s2member_level4)]Please register for PREMIUM VERSION HERE to read full post below containing analysis. In case of any error or you think you are not able to read the full post below, please email us at support#nehcap.com [lwa][/s2If] [s2If current_user_can(access_s2member_level4)]
- Gold price is looking to shift its auction above $2,000.00 as the Fed doesn’t believe more rate hikes are appropriate.
- Further tightening of credit conditions by US banks would result in lower inflation, and cooling demand.
- Gold price is now marching towards the ultimate resistance plotted from August 2020 high at $2,075.32.
The pair currently trades last at 1992.61.
The previous day high was 1978.93 while the previous day low was 1934.34. The daily 38.2% Fib levels comes at 1961.9, expected to provide support. Similarly, the daily 61.8% fib level is at 1951.37, expected to provide support.
Gold price (XAU/USD) is oscillating in a narrow range of $1,990-2,000 in the early Asian session. The precious metal is struggling to shift its auction above the psychological resistance of $2,000. However, the upside looks favored as the Federal Reserve (Fed) has come closer to halting its policy-tightening cycle after eight consecutive hikes in the past year.
Fed chair Jerome Powell commented that some hikes might be appropriate to make the policy restrictive enough to tame the stubborn inflation. Also, it would not be worth hiking rates further in times when the United States economy is facing the fears of a potential banking crisis.
As the battle against stick inflation is still on, higher rates for a longer period will continue to weigh on persistent US inflation. Also, further tightening of credit conditions by commercial banks to avoid increment in Non-Performing Assets (NPAs) would result in lower inflation, cooling demand, and a dismal economic outlook.
Meanwhile, S&P500 futures showed some recovery on Thursday as investors are cheering that the economy is somehow clear about the terminal rate, which would help firms to design their strategy for further operations, portraying a risk-appetite theme. The US Dollar Index (DXY) defended the 102.00 support, however, the expression of fewer rate hikes ahead would maintain pressure on it.
On Friday, investors will keenly watch the US Durable Goods Orders data. As per the consensus, the economic data will expand by 0.6% against a contraction of 4.5%. Investors should be aware that the mighty Fed is not bound to stay on commentary and could continue its rate-hiking spell if forward demand continues to grow.
Gold price has rebounded from the demand zone plotted in a range of $1,947-1,960 on a weekly scale. The precious metal is now marching towards the ultimate resistance plotted from August 2020 high at $2,075.32.
The 10-period Exponential Moving Average (EMA) will continue to act as a cushion for the Gold price.
Meanwhile, the Relative Strength Index (RSI) (14) has reclaimed the bullish range of 60.00-80.00. More upside looks solid as the momentum oscillator is not showing any sign of divergence and overbought situation.
Technical Levels: Supports and Resistances
XAUUSD currently trading at 1993.19 at the time of writing. Pair opened at 1970.35 and is trading with a change of 1.16 % .
| Overview | Overview.1 | |
|---|---|---|
| 0 | Today last price | 1993.19 |
| 1 | Today Daily Change | 22.84 |
| 2 | Today Daily Change % | 1.16 |
| 3 | Today daily open | 1970.35 |
The pair remains strongly bullish on the daily timeframe. It trades above its 20 SMA @ 1875.85, 50 SMA 1884.9, 100 SMA @ 1833.88 and 200 SMA @ 1779.1.
| Trends | Trends.1 | |
|---|---|---|
| 0 | Daily SMA20 | 1875.85 |
| 1 | Daily SMA50 | 1884.90 |
| 2 | Daily SMA100 | 1833.88 |
| 3 | Daily SMA200 | 1779.10 |
The previous day high was 1978.93 while the previous day low was 1934.34. The daily 38.2% Fib levels comes at 1961.9, expected to provide support. Similarly, the daily 61.8% fib level is at 1951.37, expected to provide support.
Note the levels of interest below:
- Pivot support is noted at 1943.48, 1916.62, 1898.89
- Pivot resistance is noted at 1988.07, 2005.8, 2032.66
| Levels | Levels.1 |
|---|---|
| Previous Daily High | 1978.93 |
| Previous Daily Low | 1934.34 |
| Previous Weekly High | 1989.51 |
| Previous Weekly Low | 1867.66 |
| Previous Monthly High | 1959.80 |
| Previous Monthly Low | 1804.76 |
| Daily Fibonacci 38.2% | 1961.90 |
| Daily Fibonacci 61.8% | 1951.37 |
| Daily Pivot Point S1 | 1943.48 |
| Daily Pivot Point S2 | 1916.62 |
| Daily Pivot Point S3 | 1898.89 |
| Daily Pivot Point R1 | 1988.07 |
| Daily Pivot Point R2 | 2005.80 |
| Daily Pivot Point R3 | 2032.66 |
[/s2If]
Join Our Telegram Group
")


