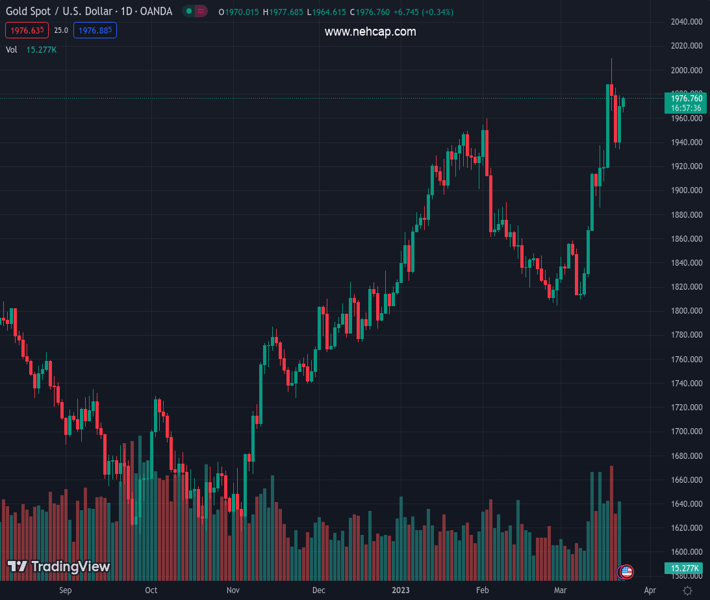
#XAUUSD @ 1,976.56 Gold price is marching toward $1,980.00 as fears of a US banking crisis renewed. (Pivot Orderbook analysis)
…
This is a premium post.
[s2If !current_user_can(access_s2member_level4)]Please register for PREMIUM VERSION HERE to read full post below containing analysis. In case of any error or you think you are not able to read the full post below, please email us at support#nehcap.com [lwa][/s2If] [s2If current_user_can(access_s2member_level4)]
- Gold price is marching toward $1,980.00 as fears of a US banking crisis renewed.
- The USD Index has been battered as Fed has come extremely close to the terminal rate.
- US bonds have been resilient as the US government is not considering insuring all uninsured bank deposits.
The pair currently trades last at 1976.56.
The previous day high was 1978.93 while the previous day low was 1934.34. The daily 38.2% Fib levels comes at 1961.9, expected to provide support. Similarly, the daily 61.8% fib level is at 1951.37, expected to provide support.
Gold price (XAU/USD) is gathering strength to capture the immediate resistance of $1,980.00 in the Asian session. The precious metal has found demand as the US Dollar Index (DXY) has resumed its downside journey and fears of a US banking crisis have refreshed.
The USD Index is looking to refresh its six-month low below 102.00 as the Federal Reserve (Fed) has come extremely close to the terminal rate, which would be restrictive enough to bring down the United States inflation to 2%. Fed chair Jerome Powell in his commentary stated, “some additional policy firming may be appropriate”.
Investors should be aware of the fact that the US banking fiasco had underpinned Gold as a safe-haven to dodge volatility. However, an assurance of safety for all banking deposits from US Treasury Secretary Janet Yellen had receded fears of the banking crisis.
The situation seems changed now as US Yellen commented on Wednesday that the government “is not considering insuring all uninsured bank deposits.” This has also strengthened the demand for US government bonds. The 10-year US Treasury yields have dropped further to near 3.45%.
Meanwhile, S&P500 futures have recovered firmly after a dive move on Wednesday, portraying an improvement in the risk appetite, however, caution still prevails as tight credit conditions from US banks will have a long-term impact. As per Fed’s commentary, US banking is sound and resilient but US banks will be more precautionary while disbursing advances to households and businesses.
Gold price has shown a stellar recovery after sensing significant buying interest around the demand zone placed in a range of $1,933.90-1,938.40 on an hourly scale. The asset is marching towards the critical resistance plotted from March 20 high at $2,009.88.
A bull cross, represented by the 20-and 50-period Exponential Moving Averages (EMAs) at $1,954.39, adds to the upside filters.
The Relative Strength Index (RSI) (14) is oscillating in the bullish range of 60.00-80.00, which indicates more upside ahead.
Technical Levels: Supports and Resistances
XAUUSD currently trading at 1974.7 at the time of writing. Pair opened at 1970.35 and is trading with a change of 0.22 % .
| Overview | Overview.1 | |
|---|---|---|
| 0 | Today last price | 1974.70 |
| 1 | Today Daily Change | 4.35 |
| 2 | Today Daily Change % | 0.22 |
| 3 | Today daily open | 1970.35 |
The pair remains strongly bullish on the daily timeframe. It trades above its 20 SMA @ 1875.85, 50 SMA 1884.9, 100 SMA @ 1833.88 and 200 SMA @ 1779.1.
| Trends | Trends.1 | |
|---|---|---|
| 0 | Daily SMA20 | 1875.85 |
| 1 | Daily SMA50 | 1884.90 |
| 2 | Daily SMA100 | 1833.88 |
| 3 | Daily SMA200 | 1779.10 |
The previous day high was 1978.93 while the previous day low was 1934.34. The daily 38.2% Fib levels comes at 1961.9, expected to provide support. Similarly, the daily 61.8% fib level is at 1951.37, expected to provide support.
Note the levels of interest below:
- Pivot support is noted at 1943.48, 1916.62, 1898.89
- Pivot resistance is noted at 1988.07, 2005.8, 2032.66
| Levels | Levels.1 |
|---|---|
| Previous Daily High | 1978.93 |
| Previous Daily Low | 1934.34 |
| Previous Weekly High | 1989.51 |
| Previous Weekly Low | 1867.66 |
| Previous Monthly High | 1959.80 |
| Previous Monthly Low | 1804.76 |
| Daily Fibonacci 38.2% | 1961.90 |
| Daily Fibonacci 61.8% | 1951.37 |
| Daily Pivot Point S1 | 1943.48 |
| Daily Pivot Point S2 | 1916.62 |
| Daily Pivot Point S3 | 1898.89 |
| Daily Pivot Point R1 | 1988.07 |
| Daily Pivot Point R2 | 2005.80 |
| Daily Pivot Point R3 | 2032.66 |
[/s2If]
Join Our Telegram Group
")


