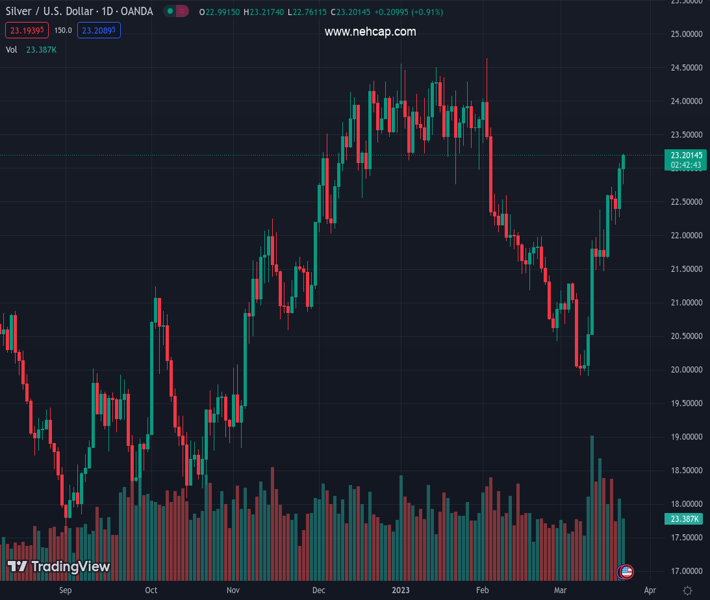
#XAGUSD @ 23.187 Silver price remains underpinned by a soft US Dollar and depressed US bond yields. (Pivot Orderbook analysis)
…
This is a premium post.
[s2If !current_user_can(access_s2member_level4)]Please register for PREMIUM VERSION HERE to read full post below containing analysis. In case of any error or you think you are not able to read the full post below, please email us at support#nehcap.com [lwa][/s2If] [s2If current_user_can(access_s2member_level4)]
- Silver price remains underpinned by a soft US Dollar and depressed US bond yields.
- XAG/USD Price Analysis: A daily close above $23.00 could exacerbate a rally toward YTD highs.
The pair currently trades last at 23.187.
The previous day high was 23.07 while the previous day low was 22.27. The daily 38.2% Fib levels comes at 22.77, expected to provide support. Similarly, the daily 61.8% fib level is at 22.58, expected to provide support.
Silver price advances sharply to fresh six-week highs in the North American session, courtesy of a weak US Dollar (USD), which remains downward pressured by falling US Treasury bond yields. Hence, the XAG/USD is trading at $23.12 after hitting a daily low of $22.76.
During the Federal Reserve’s (Fed) monetary policy decision, the XAG/USD traded sideways around the $22.20s area before the US Treasury bond yields tumbled. After that, Silver rallied and tested the $23.00 figure before pulling back and closing at $22.97. However, Thursday’s price action resumed upwards, with buyers piling around the $22.70 area, and lifted XAG/USD price above the $23.00 mark.
Although the XAG/USD bias is neutral, the 20-day Exponential Moving Average (EMA) at $21.87 exceeded the 200-day EMA at $21.83. That could exacerbate another leg-up in Silver prices, and the white metal could test the YTD high at $24.63.
The XAG/USD first resistance would be the February 3 daily high at $23.59. Once cleared, the XAG/USD will be headed toward the $24.00 mark. Once broken, Silver will be poised to test the YTD high at $24.63.
In an alternate scenario, the XAG/USD first support would be $23.00. A daily close below the latter will keep XAG/USD price downward pressured.
Technical Levels: Supports and Resistances
XAGUSD currently trading at 23.17 at the time of writing. Pair opened at 22.97 and is trading with a change of 0.87 % .
| Overview | Overview.1 | |
|---|---|---|
| 0 | Today last price | 23.17 |
| 1 | Today Daily Change | 0.20 |
| 2 | Today Daily Change % | 0.87 |
| 3 | Today daily open | 22.97 |
The pair remains strongly bullish on the daily timeframe. It trades above its 20 SMA @ 21.3, 50 SMA 22.28, 100 SMA @ 22.42 and 200 SMA @ 20.96.
| Trends | Trends.1 | |
|---|---|---|
| 0 | Daily SMA20 | 21.30 |
| 1 | Daily SMA50 | 22.28 |
| 2 | Daily SMA100 | 22.42 |
| 3 | Daily SMA200 | 20.96 |
The previous day high was 23.07 while the previous day low was 22.27. The daily 38.2% Fib levels comes at 22.77, expected to provide support. Similarly, the daily 61.8% fib level is at 22.58, expected to provide support.
Note the levels of interest below:
- Pivot support is noted at 22.47, 21.97, 21.67
- Pivot resistance is noted at 23.27, 23.57, 24.07
| Levels | Levels.1 |
|---|---|
| Previous Daily High | 23.07 |
| Previous Daily Low | 22.27 |
| Previous Weekly High | 22.61 |
| Previous Weekly Low | 20.54 |
| Previous Monthly High | 24.64 |
| Previous Monthly Low | 20.42 |
| Daily Fibonacci 38.2% | 22.77 |
| Daily Fibonacci 61.8% | 22.58 |
| Daily Pivot Point S1 | 22.47 |
| Daily Pivot Point S2 | 21.97 |
| Daily Pivot Point S3 | 21.67 |
| Daily Pivot Point R1 | 23.27 |
| Daily Pivot Point R2 | 23.57 |
| Daily Pivot Point R3 | 24.07 |
[/s2If]
Join Our Telegram Group
")


