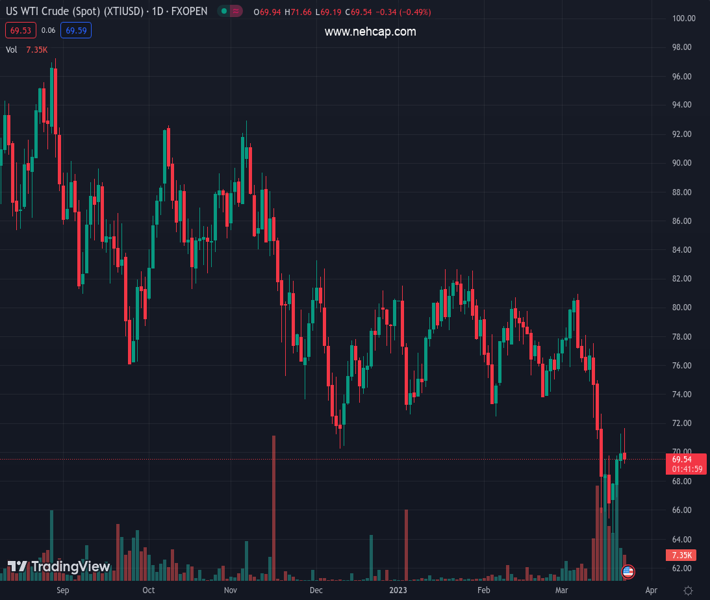
West Texas Intermediate crude is sinking on Thursday. (Pivot Orderbook analysis)
…
This is a premium post.
[s2If !current_user_can(access_s2member_level4)]Please register for PREMIUM VERSION HERE to read full post below containing analysis. In case of any error or you think you are not able to read the full post below, please email us at support#nehcap.com [lwa][/s2If] [s2If current_user_can(access_s2member_level4)]
- West Texas Intermediate crude is sinking on Thursday.
- Investors fear a recession in the aftermath of the Fed.
The pair currently trades last at 69.54.
The previous day high was 71.33 while the previous day low was 68.92. The daily 38.2% Fib levels comes at 70.41, expected to provide resistance. Similarly, the daily 61.8% fib level is at 69.84, expected to provide resistance.
West Texas Intermediate crude oil is lower on Thursday despite risk-on markets that continued to digest the more dovish guidance from the Federal Open Market Committee. However, the prediction from the central bank of more to come renewed recession concerns and has weighed on the oil price. West Texas Intermediate is currently down by some 1% after falling from a high of $71.63 and printing a low of $69.24 so far.
The drop came after the Federal Reserve on Wednesday raised interest rates as expected by 25 basis points and said more hikes are likely on the way. However, a clouded outlook due to the risks associated with the banking sector troubles is weighing on the oil price also. Additionally, US Treasury Secretary Janet Yellin warned that the United States government will not automatically insure all deposits in future bank rescues.
Meanwhile, the rise in US oil inventories was seen in the report from the Energy Information Administration. There was a rise of 1.1-million barrels in stock the prior week vs. the estimate of a 1.8-million barrel drop.
Analysts at TD Securities argued that the spring is coiled in energy markets. ´´While CTA short acquisitions helped to fuel downside before a technical break catalyzed a large-scale stop-out, buying activity is unlikely to gain steam until WTI crude prices break the $78.50/bbl range,´´ the analysts argued.
´´With every single trend indicator on our screen already pointing to the downside, selling activity has run out of steam and algos stand ready to lift some offers. Strong crack spreads associated with refinery outages dampening supply and resilient demand could potentially act as a catalyst.´´
Technical Levels: Supports and Resistances
XTIUSD currently trading at 69.54 at the time of writing. Pair opened at 69.93 and is trading with a change of -0.56 % .
| Overview | Overview.1 | |
|---|---|---|
| 0 | Today last price | 69.54 |
| 1 | Today Daily Change | -0.39 |
| 2 | Today Daily Change % | -0.56 |
| 3 | Today daily open | 69.93 |
The pair remains strongly bearish on the daily time frame. It trades below the 20 SMA @ 74.24, 50 SMA 76.83, 100 SMA @ 78.04 and 200 SMA @ 84.87.
| Trends | Trends.1 | |
|---|---|---|
| 0 | Daily SMA20 | 74.24 |
| 1 | Daily SMA50 | 76.83 |
| 2 | Daily SMA100 | 78.04 |
| 3 | Daily SMA200 | 84.87 |
The previous day high was 71.33 while the previous day low was 68.92. The daily 38.2% Fib levels comes at 70.41, expected to provide resistance. Similarly, the daily 61.8% fib level is at 69.84, expected to provide resistance.
Note the levels of interest below:
- Pivot support is noted at 68.79, 67.65, 66.38
- Pivot resistance is noted at 71.2, 72.47, 73.61
| Levels | Levels.1 |
|---|---|
| Previous Daily High | 71.33 |
| Previous Daily Low | 68.92 |
| Previous Weekly High | 77.55 |
| Previous Weekly Low | 65.44 |
| Previous Monthly High | 80.75 |
| Previous Monthly Low | 72.50 |
| Daily Fibonacci 38.2% | 70.41 |
| Daily Fibonacci 61.8% | 69.84 |
| Daily Pivot Point S1 | 68.79 |
| Daily Pivot Point S2 | 67.65 |
| Daily Pivot Point S3 | 66.38 |
| Daily Pivot Point R1 | 71.20 |
| Daily Pivot Point R2 | 72.47 |
| Daily Pivot Point R3 | 73.61 |
[/s2If]
Join Our Telegram Group
")


