#USDMXN @ 18.5497 fades bounce off one-week low as 50-DMA pushes back bullish bias., @nehcap view: Further downside expected (Pivot Orderbook analysis)
…
This is a premium post.
[s2If !current_user_can(access_s2member_level4)]Please register for PREMIUM VERSION HERE to read full post below containing analysis. In case of any error or you think you are not able to read the full post below, please email us at support#nehcap.com [lwa][/s2If] [s2If current_user_can(access_s2member_level4)]
- USD/MXN fades bounce off one-week low as 50-DMA pushes back bullish bias.
- Bullish candlestick formation, clear bounce off 21-DMA challenges sellers.
- MACD, RSI conditions suggest further grinding towards the south.
- Buyers need successful break of 61.8% Fibonacci retracement for conviction.
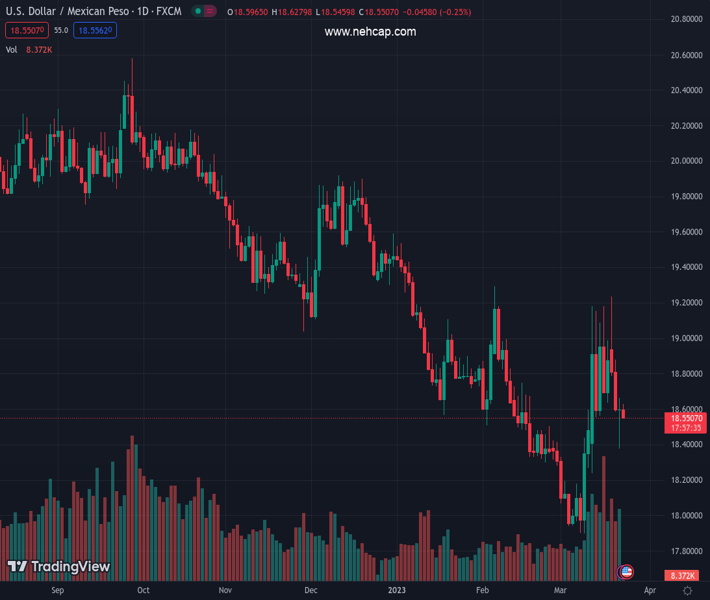
The pair currently trades last at 18.5497.
The previous day high was 18.6626 while the previous day low was 18.3797. The daily 38.2% Fib levels comes at 18.5545, expected to provide resistance. Similarly, the daily 61.8% fib level is at 18.4877, expected to provide support.
USD/MXN takes offers to refresh intraday low near 18.57 during early Thursday, reversing the previous day’s rebound from the 21-DMA.
In doing so, the Mexican Peso (MXN) pair fails to justify Wednesday’s Dragonfly Doji bullish candlestick while dropping back towards the lowest levels since March 13 marked on the previous day.
It’s worth noting that the USD/MXN pair’s failure to cross the 50-DMA during late Wednesday’s corrective bounce keeps the sellers hopeful. Adding strength to the downside bias is the downward-sloping MACD line and the RSI (14) retreat.
As a result, the USD/MXN is likely to drop back to the 21-DMA support of 18.44 before highlighting the 18.30 support.
In a case where the Mexican Peso pair drops below 18.30, the 18.00 threshold could act as the last defense of the bulls before highlighting the odds of witnessing a fresh low since 2017, currently 17.90.
Alternatively, recovery moves need validation from the 50-DMA hurdle of 18.60 to renew upside momentum targeting the 50% and 61.8% Fibonacci retracements of the USD/MXN pair’s fall from December 2022 to March, respectively near 18.90 and 19.15.
Should the USD/MXN pair rises past 19.15, February’s high of 19.30 can challenge the buyers for the one last time.
Trend: Further downside expected
Technical Levels: Supports and Resistances
USDMXN currently trading at 18.5749 at the time of writing. Pair opened at 18.6056 and is trading with a change of -0.17% % .
| Overview | Overview.1 | |
|---|---|---|
| 0 | Today last price | 18.5749 |
| 1 | Today Daily Change | -0.0307 |
| 2 | Today Daily Change % | -0.17% |
| 3 | Today daily open | 18.6056 |
The pair is trading above its 20 Daily moving average @ 18.4346, below its 50 Daily moving average @ 18.6111 , below its 100 Daily moving average @ 19.0383 and below its 200 Daily moving average @ 19.5982
| Trends | Trends.1 | |
|---|---|---|
| 0 | Daily SMA20 | 18.4346 |
| 1 | Daily SMA50 | 18.6111 |
| 2 | Daily SMA100 | 19.0383 |
| 3 | Daily SMA200 | 19.5982 |
The previous day high was 18.6626 while the previous day low was 18.3797. The daily 38.2% Fib levels comes at 18.5545, expected to provide resistance. Similarly, the daily 61.8% fib level is at 18.4877, expected to provide support.
Note the levels of interest below:
- Pivot support is noted at 18.436, 18.2664, 18.1531
- Pivot resistance is noted at 18.7189, 18.8322, 19.0019
| Levels | Levels.1 |
|---|---|
| Previous Daily High | 18.6626 |
| Previous Daily Low | 18.3797 |
| Previous Weekly High | 19.1812 |
| Previous Weekly Low | 18.2397 |
| Previous Monthly High | 19.2901 |
| Previous Monthly Low | 18.2954 |
| Daily Fibonacci 38.2% | 18.5545 |
| Daily Fibonacci 61.8% | 18.4877 |
| Daily Pivot Point S1 | 18.4360 |
| Daily Pivot Point S2 | 18.2664 |
| Daily Pivot Point S3 | 18.1531 |
| Daily Pivot Point R1 | 18.7189 |
| Daily Pivot Point R2 | 18.8322 |
| Daily Pivot Point R3 | 19.0019 |
[/s2If]
Join Our Telegram Group
")


