#USDMXN @ 18.5049 US Initial Jobless Claims continued their downward trend, portraying a tight labor market. (Pivot Orderbook analysis)
…
This is a premium post.
[s2If !current_user_can(access_s2member_level4)]Please register for PREMIUM VERSION HERE to read full post below containing analysis. In case of any error or you think you are not able to read the full post below, please email us at support#nehcap.com [lwa][/s2If] [s2If current_user_can(access_s2member_level4)]
- US Initial Jobless Claims continued their downward trend, portraying a tight labor market.
- Retail Sales in Mexico exceeded estimates and bolstered the Mexican Peso.
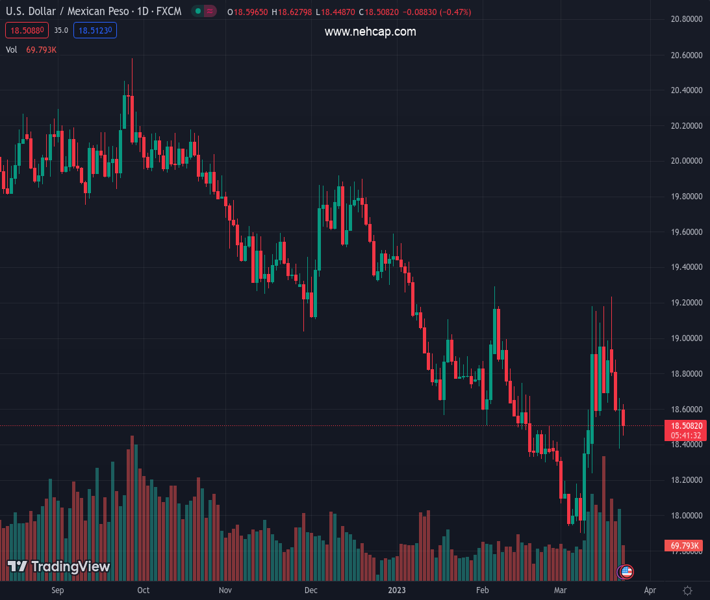
- USD/MXN Price Analysis: Could resume its bearish bias below $18.50.
The pair currently trades last at 18.5049.
The previous day high was 18.6626 while the previous day low was 18.3797. The daily 38.2% Fib levels comes at 18.5545, expected to provide resistance. Similarly, the daily 61.8% fib level is at 18.4877, expected to provide support.
The Mexican Peso (MXN) recovers against the US Dollar (USD) as the USD/MXN registers losses of 0.57% and stumbles below the 20-day EMA. Following the US Federal Reserve’s (Fed) decision to tighten monetary conditions, a risk-on impulse keeps the emerging country currency underpinned at around $18.50. At the time of writing, the USD/MXN is trading at 18.4868.
Wall Street is trading with solid gains after the US Treasury Secretary Janet Yellen rattled investors after saying that the United States (US) government is not planning to introduce blanket insurance to all depositors. Contrarily, Fed Chair Jerome Powell said that the banking system is solid after the Fed took steps to provide liquidity to the markets.
Unemployment claims for the week ending on March 18 fell by 1,000, warranting further tightening by the Fed amidst a tight labor market. The US Department of Labor (DoL) revealed that 191,000 Americans filled for aid after being laid off, contrary to the expected jump of 201,000 as reported by the consensus. At the same time, the Chicago Fed National Activity Index for February plunged to -0.19 vs. the prior’s month 0.23
Consequently, US Treasury bond yields continue to fall, weighed by investors expecting an additional rate hike by the Fed and then a pause. The 2-year bond yield dropped to 3.90%, down one bps, while the 10-year bond yield climbed to 3.464%. That undermined the greenback, with the US Dollar Index (DXY) falling 0.33% at 102.187.
On the Mexican front, Retail Sales in January jumped 1.6% from December, as the national statistics agency (INEGI) reported. Annually based, sales rose 5.3%.
Additionally, Mid-month inflation for March rose 0.15% MoM, less than estimates of 0.28%, while the YoY reading decelerated to 7.12%, from the prior’s 7.76%. Core inflation on its annual and monthly readings was unchanged for the same period.
On Wednesday, the USD/MXN failed to close below the 20-day Exponential Moving Average (EMA) of 18.5524 and formed a dragonfly doji, which could open the door for further upside. Though USD/MXN traders need to reclaim the 18.8769, the pair could head up toward the $19.00 barrier. On the other hand, if the USD/MXN closes below $18.50, that would pave the way for further losses. The USD/MXN first support would be the March 23 low of 18.3776, followed by the March 13 low of 18.4487, ahead of testing the YTD low at 17.8967.
Technical Levels: Supports and Resistances
USDMXN currently trading at 18.5242 at the time of writing. Pair opened at 18.6056 and is trading with a change of -0.44 % .
| Overview | Overview.1 | |
|---|---|---|
| 0 | Today last price | 18.5242 |
| 1 | Today Daily Change | -0.0814 |
| 2 | Today Daily Change % | -0.4400 |
| 3 | Today daily open | 18.6056 |
The pair is trading above its 20 Daily moving average @ 18.4346, below its 50 Daily moving average @ 18.6111 , below its 100 Daily moving average @ 19.0383 and below its 200 Daily moving average @ 19.5982
| Trends | Trends.1 | |
|---|---|---|
| 0 | Daily SMA20 | 18.4346 |
| 1 | Daily SMA50 | 18.6111 |
| 2 | Daily SMA100 | 19.0383 |
| 3 | Daily SMA200 | 19.5982 |
The previous day high was 18.6626 while the previous day low was 18.3797. The daily 38.2% Fib levels comes at 18.5545, expected to provide resistance. Similarly, the daily 61.8% fib level is at 18.4877, expected to provide support.
Note the levels of interest below:
- Pivot support is noted at 18.436, 18.2664, 18.1531
- Pivot resistance is noted at 18.7189, 18.8322, 19.0019
| Levels | Levels.1 |
|---|---|
| Previous Daily High | 18.6626 |
| Previous Daily Low | 18.3797 |
| Previous Weekly High | 19.1812 |
| Previous Weekly Low | 18.2397 |
| Previous Monthly High | 19.2901 |
| Previous Monthly Low | 18.2954 |
| Daily Fibonacci 38.2% | 18.5545 |
| Daily Fibonacci 61.8% | 18.4877 |
| Daily Pivot Point S1 | 18.4360 |
| Daily Pivot Point S2 | 18.2664 |
| Daily Pivot Point S3 | 18.1531 |
| Daily Pivot Point R1 | 18.7189 |
| Daily Pivot Point R2 | 18.8322 |
| Daily Pivot Point R3 | 19.0019 |
[/s2If]
Join Our Telegram Group
")


