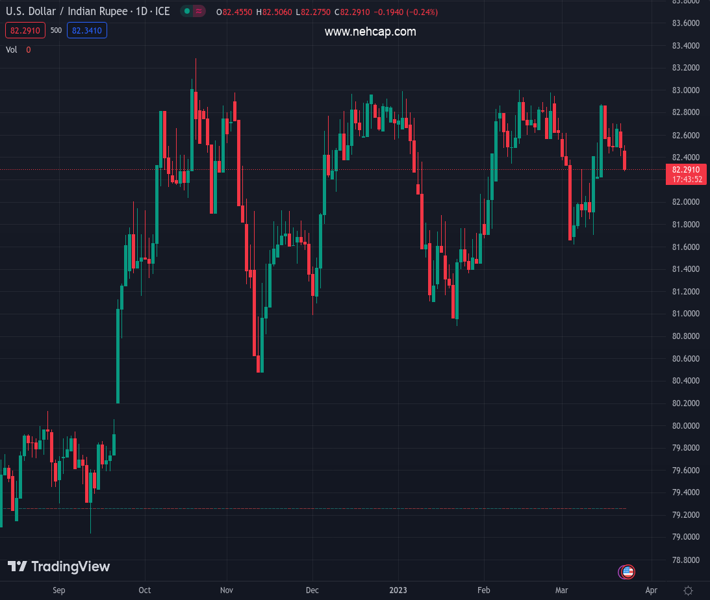
#USDINR @ 82.3175 keeps Fed-induced losses around one-week low, depressed of late. (Pivot Orderbook analysis)
…
This is a premium post.
[s2If !current_user_can(access_s2member_level4)]Please register for PREMIUM VERSION HERE to read full post below containing analysis. In case of any error or you think you are not able to read the full post below, please email us at support#nehcap.com [lwa][/s2If] [s2If current_user_can(access_s2member_level4)]
- USD/INR keeps Fed-induced losses around one-week low, depressed of late.
- Fed’s dovish rate hike joins cautious optimism in Asia to underpin Indian Rupee strength.
- Yields remain pressured as bank fears propel market’s rush toward bonds, Gold price.
- Some more central bank decisions, second-tier data to entertain traders but banking sector turmoil keeps USD/INR bears hopeful.
The pair currently trades last at 82.3175.
The previous day high was 82.8926 while the previous day low was 82.3847. The daily 38.2% Fib levels comes at 82.5787, expected to provide resistance. Similarly, the daily 61.8% fib level is at 82.6986, expected to provide resistance.
USD/INR drops to 82.30 as it extends the Federal Reserve (Fed) inflicted losses to the lowest levels in eight days during early Thursday. In doing so, the Indian Rupee (INR) pair fades a corrective bounce marked in the day’s start while declining towards the one-week low at the latest.
It’s worth noting that the weaker US Treasury bond yields weigh on the US Dollar amid the Fed’s dovish rate hike and allow the USD/INR bears to keep the reins. Also exerting downside pressure on the pair could be the cautious optimism in Asia, mainly driven by China.
That said, the US central bank confirmed the market’s expectations of announcing a 0.25% rate hike but failed to convince the policy hawks. The reason could be linked to the statements saying, “Some additional policy firming may be appropriate,” instead of previous remarks like “Ongoing increases in the target range will be appropriate.” It should be noted that the US Dollar bears ignored Fed Chair Jerome Powell’s attempt to placate rate cut bias, as well as US Treasury Secretary Janet Yellen’s comments suggesting no “blanket insurance” for bank deposits. Recently, Bloomberg also came out with the saying that the Federal Deposit Insurance Corporation (FDIC) is said to delay the bid deadline for a Silicon Valley private bank.
Hence, the banking debacle underpins the market’s rush towards the traditional safe havens like a bond, Gold and Yen, which in turn drown the US Dollar price and please the USD/INR bears. Furthermore, hopes of China’s gradual recovery, despite the banking rout, join the upbeat fundamentals surrounding India to favor the pair sellers.
Alternatively, firmer prices of Oil, up for the fourth consecutive day around $70.15 by the press time, should have challenged the INR bulls due to the Asian nation’s reliance on energy imports and record Current Account Deficit. It should be observed that holiday in India limits the Pair’s moves.
Amid these plays, S&P 500 Futures print mild gains around 3,980, up 0.13% intraday following the biggest daily slump in two weeks while the US 10-year and two-year Treasury bond yields stay pressured around 3.46% and 3.89% at the latest, licking their wounds after falling the most in a week.
Looking ahead, a holiday in India and a light calendar in Asia may allow the USD/INR to extend the latest moves. However, major attention will be given to the banking sector updates and monetary policy announcements from the Bank of England (BoE) and Swiss National Bank (SNB).
Despite the latest weakness, the USD/INR bears need validation from a two-month-old ascending support line, as well as the 100-day Exponential Moving Average (EMA), around 82.00 by the press time.
Technical Levels: Supports and Resistances
USDINR currently trading at 82.2915 at the time of writing. Pair opened at 82.5053 and is trading with a change of -0.26% % .
| Overview | Overview.1 | |
|---|---|---|
| 0 | Today last price | 82.2915 |
| 1 | Today Daily Change | -0.2138 |
| 2 | Today Daily Change % | -0.26% |
| 3 | Today daily open | 82.5053 |
The pair is trading below its 20 Daily moving average @ 82.3748, above its 50 Daily moving average @ 82.1863 , above its 100 Daily moving average @ 82.1245 and above its 200 Daily moving average @ 81.1737
| Trends | Trends.1 | |
|---|---|---|
| 0 | Daily SMA20 | 82.3748 |
| 1 | Daily SMA50 | 82.1863 |
| 2 | Daily SMA100 | 82.1245 |
| 3 | Daily SMA200 | 81.1737 |
The previous day high was 82.8926 while the previous day low was 82.3847. The daily 38.2% Fib levels comes at 82.5787, expected to provide resistance. Similarly, the daily 61.8% fib level is at 82.6986, expected to provide resistance.
Note the levels of interest below:
- Pivot support is noted at 82.2958, 82.0863, 81.788
- Pivot resistance is noted at 82.8037, 83.102, 83.3115
| Levels | Levels.1 |
|---|---|
| Previous Daily High | 82.8926 |
| Previous Daily Low | 82.3847 |
| Previous Weekly High | 83.0315 |
| Previous Weekly Low | 81.5120 |
| Previous Monthly High | 83.0820 |
| Previous Monthly Low | 81.5032 |
| Daily Fibonacci 38.2% | 82.5787 |
| Daily Fibonacci 61.8% | 82.6986 |
| Daily Pivot Point S1 | 82.2958 |
| Daily Pivot Point S2 | 82.0863 |
| Daily Pivot Point S3 | 81.7880 |
| Daily Pivot Point R1 | 82.8037 |
| Daily Pivot Point R2 | 83.1020 |
| Daily Pivot Point R3 | 83.3115 |
[/s2If]
Join Our Telegram Group
")


