#USDCHF @ 0.91640 bounced off the weekly lows around 0.9110s as the US Dollar pares its losses. (Pivot Orderbook analysis)
…
This is a premium post.
[s2If !current_user_can(access_s2member_level4)]Please register for PREMIUM VERSION HERE to read full post below containing analysis. In case of any error or you think you are not able to read the full post below, please email us at support#nehcap.com [lwa][/s2If] [s2If current_user_can(access_s2member_level4)]
- USD/CHF bounced off the weekly lows around 0.9110s as the US Dollar pares its losses.
- USD/CHF Price Analysis: To shift neutral, above 0.9200; otherwise, the YTD lows would be tested.
The pair currently trades last at 0.91640.
The previous day high was 0.9246 while the previous day low was 0.9147. The daily 38.2% Fib levels comes at 0.9185, expected to provide resistance. Similarly, the daily 61.8% fib level is at 0.9208, expected to provide resistance.
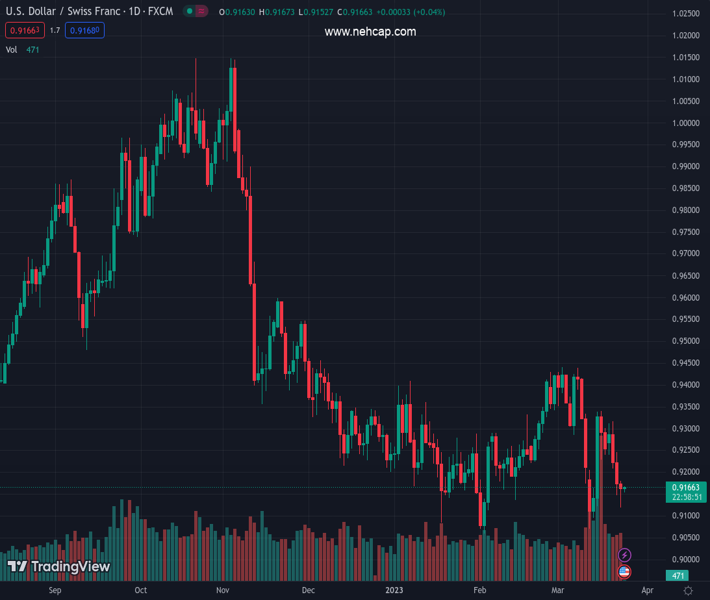
The USD/CHF finished Thursday’s session with a loss of 0.11% after hitting a low of 0.9118 and closing at around 0.9163. As the Asian session begins, the USD/CHF is trading at around 0.9160s, as sellers continued to drive prices for the fourth straight day.
The USD/CHF daily chart portrays the pair as downward biased, but Thursday’s price action formed a hammer candlestick preceded by a downtrend; it’s usually a bullish candle. But buyers need to crack March’s 23 daily high at 0.9180 if they want to drive the USD/CHF higher.
For a bullish resumption, the USD/CHF first resistance would be 0.9200. Break above, and the 20-day Exponential Moving Average (EMA) at 0.9249 would be up for grabs. The 50-day EMA would be tested at 0.9278 before the USD/CHF reaches 0.9300.
On the flip side, and the path of least resistance, the USD/CHF first support would be March’s 23 low at 0.9118. A breach of the latter and the USD/CHF will fall to the March 13 daily low at 0.9070 before challenging the YTD low at 0.9059.
Technical Levels: Supports and Resistances
USDCHF currently trading at 0.9164 at the time of writing. Pair opened at 0.9174 and is trading with a change of -0.11 % .
| Overview | Overview.1 | |
|---|---|---|
| 0 | Today last price | 0.9164 |
| 1 | Today Daily Change | -0.0010 |
| 2 | Today Daily Change % | -0.1100 |
| 3 | Today daily open | 0.9174 |
The pair remains strongly bearish on the daily time frame. It trades below the 20 SMA @ 0.9312, 50 SMA 0.9257, 100 SMA @ 0.9343 and 200 SMA @ 0.9536.
| Trends | Trends.1 | |
|---|---|---|
| 0 | Daily SMA20 | 0.9312 |
| 1 | Daily SMA50 | 0.9257 |
| 2 | Daily SMA100 | 0.9343 |
| 3 | Daily SMA200 | 0.9536 |
The previous day high was 0.9246 while the previous day low was 0.9147. The daily 38.2% Fib levels comes at 0.9185, expected to provide resistance. Similarly, the daily 61.8% fib level is at 0.9208, expected to provide resistance.
Note the levels of interest below:
- Pivot support is noted at 0.9132, 0.909, 0.9034
- Pivot resistance is noted at 0.9231, 0.9288, 0.9329
| Levels | Levels.1 |
|---|---|
| Previous Daily High | 0.9246 |
| Previous Daily Low | 0.9147 |
| Previous Weekly High | 0.9342 |
| Previous Weekly Low | 0.9072 |
| Previous Monthly High | 0.9429 |
| Previous Monthly Low | 0.9059 |
| Daily Fibonacci 38.2% | 0.9185 |
| Daily Fibonacci 61.8% | 0.9208 |
| Daily Pivot Point S1 | 0.9132 |
| Daily Pivot Point S2 | 0.9090 |
| Daily Pivot Point S3 | 0.9034 |
| Daily Pivot Point R1 | 0.9231 |
| Daily Pivot Point R2 | 0.9288 |
| Daily Pivot Point R3 | 0.9329 |
[/s2If]
Join Our Telegram Group
")


