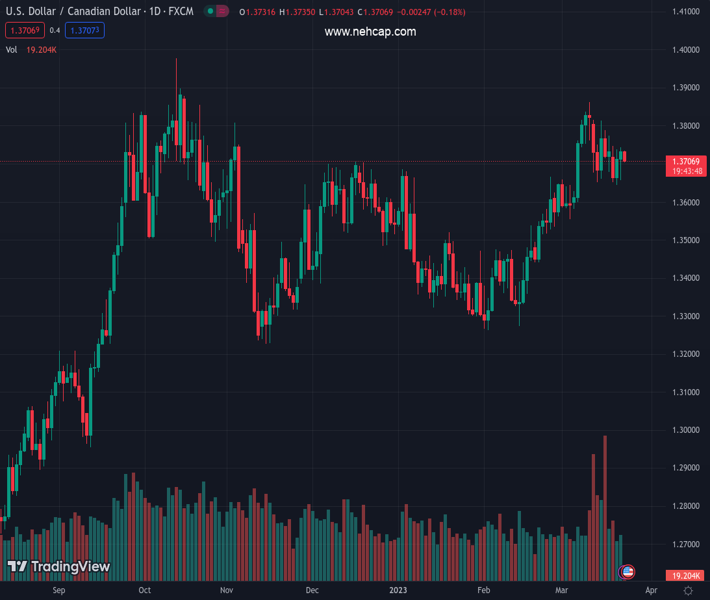
#USDCAD @ 1.37074 takes offers to refresh intraday low during the first loss-making day in three. (Pivot Orderbook analysis)
…
This is a premium post.
[s2If !current_user_can(access_s2member_level4)]Please register for PREMIUM VERSION HERE to read full post below containing analysis. In case of any error or you think you are not able to read the full post below, please email us at support#nehcap.com [lwa][/s2If] [s2If current_user_can(access_s2member_level4)]
- USD/CAD takes offers to refresh intraday low during the first loss-making day in three.
- US Dollar fails to cheer Fed’s 0.25% rate hike as policy pivot talks gained attention.
- WTI ignores downbeat EIA Crude Oil Stocks Change amid hopes of more energy demand, cheers softer USD.
- Second-tier US, Canada statistics can entertain traders ahead of Friday’s key data.
The pair currently trades last at 1.37074.
The previous day high was 1.3745 while the previous day low was 1.3657. The daily 38.2% Fib levels comes at 1.3711, expected to provide resistance. Similarly, the daily 61.8% fib level is at 1.369, expected to provide support.
USD/CAD bears return to the table, after a two-day absence, as broad US Dollar weakness joins the Oil price run-up during early Thursday. With this, the Loonie pair renews its intraday low near 1.3700 during the sluggish Asian session.
That said, the US Dollar Index (DXY) drops for the sixth consecutive day as bears poke the 102.30 mark while staying around the lowest levels since early February, marked the previous day. In doing so, the greenback’s gauge versus six major currencies fails to cheer the Federal Reserve’s (Fed) 25 basis points (bps) rate hike amid dovish concerns surrounding the US central bank’s next move, as well as fears surrounding the US banking sector.
Fed matched the market’s expectations of announcing a 0.25% rate hike but the statements saying, “some additional policy firming may be appropriate,” instead of previous remarks like “ongoing increases in the target range will be appropriate” pushed back the policy hawks.
It should be noted that Fed Chair Jerome Powell and US Treasury Secretary Janet Yellen’s comments were more important as Fed’s Powell said that officials do not see rate cuts for this year, which in turn allowed breathing space to the greenback bears in the last. On the other hand, US Treasury Secretary Janet Yellen ruled out considering “blanket insurance” for bank deposits. Recently, Bloomberg also came out with the news suggesting that the Federal Deposit Insurance Corporation is said to delay the bid deadline for a Silicon Valley private bank.
Elsewhere, WTI crude oil rises for the fourth consecutive day while extending the early-week rebound from the lowest levels since December 2021, up 0.52% intraday near $70.30 by the press time. In doing so, the black gold cheers hopes of more energy demand, driven by optimism surrounding China, while ignoring a surprise build in weekly inventories. That said, the weekly Crude Oil inventory data from the US Energy Information Administration (EIA) signaled that the stockpile grew 1.117M versus expected prints of -1.448M and 1.55M prior.
Against this backdrop, the US 10-year and two-year Treasury bond yields stay pressured around 3.48% and 3.96% at the latest while the S&P 500 Futures print mild gains even after Wall Street’s downbeat performance.
Looking ahead, second-tier numbers from the US and Canada can entertain USD/CAD pair traders ahead of Friday’s key Canadian Retail Sales and the US Durable Goods Orders for January and February respectively.
USD/CAD stays on the bear’s radar unless providing a daily close beyond the 1.3720-30 resistance confluence, comprising the 10-DMA and a two-week-old descending trend line.
Technical Levels: Supports and Resistances
USDCAD currently trading at 1.3706 at the time of writing. Pair opened at 1.3732 and is trading with a change of -0.19% % .
| Overview | Overview.1 | |
|---|---|---|
| 0 | Today last price | 1.3706 |
| 1 | Today Daily Change | -0.0026 |
| 2 | Today Daily Change % | -0.19% |
| 3 | Today daily open | 1.3732 |
The pair remains strongly bullish on the daily timeframe. It trades above its 20 SMA @ 1.3686, 50 SMA 1.3515, 100 SMA @ 1.3511 and 200 SMA @ 1.3352.
| Trends | Trends.1 | |
|---|---|---|
| 0 | Daily SMA20 | 1.3686 |
| 1 | Daily SMA50 | 1.3515 |
| 2 | Daily SMA100 | 1.3511 |
| 3 | Daily SMA200 | 1.3352 |
The previous day high was 1.3745 while the previous day low was 1.3657. The daily 38.2% Fib levels comes at 1.3711, expected to provide resistance. Similarly, the daily 61.8% fib level is at 1.369, expected to provide support.
Note the levels of interest below:
- Pivot support is noted at 1.3678, 1.3623, 1.359
- Pivot resistance is noted at 1.3765, 1.3799, 1.3853
| Levels | Levels.1 |
|---|---|
| Previous Daily High | 1.3745 |
| Previous Daily Low | 1.3657 |
| Previous Weekly High | 1.3828 |
| Previous Weekly Low | 1.3652 |
| Previous Monthly High | 1.3666 |
| Previous Monthly Low | 1.3262 |
| Daily Fibonacci 38.2% | 1.3711 |
| Daily Fibonacci 61.8% | 1.3690 |
| Daily Pivot Point S1 | 1.3678 |
| Daily Pivot Point S2 | 1.3623 |
| Daily Pivot Point S3 | 1.3590 |
| Daily Pivot Point R1 | 1.3765 |
| Daily Pivot Point R2 | 1.3799 |
| Daily Pivot Point R3 | 1.3853 |
[/s2If]
Join Our Telegram Group
")


